Figure 5.
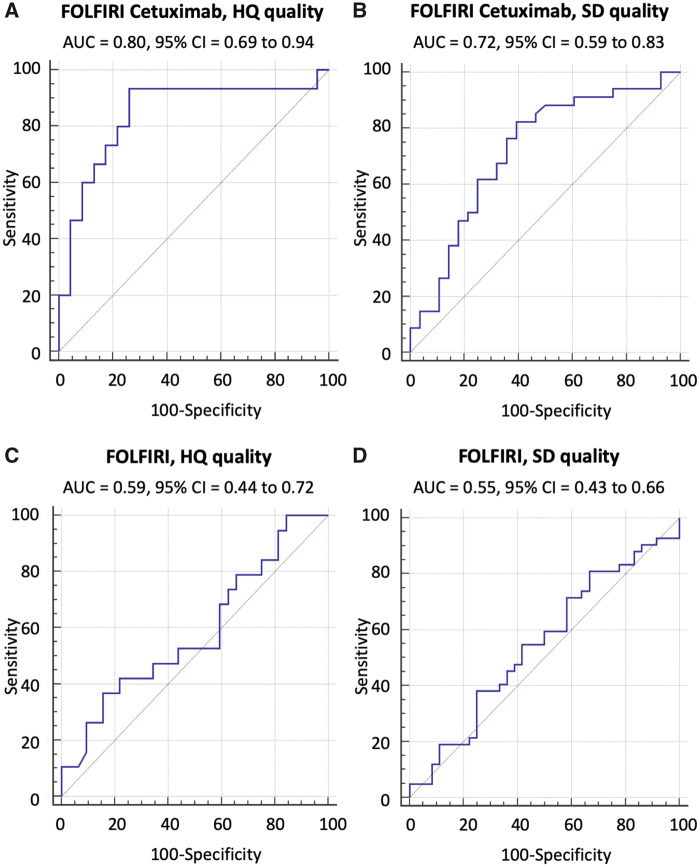
Performance of the signature in the validation sets of the three independent testing cohorts. CT quality was classified as high (HQ) or standard (SD). The Random Forest algorithm using the 4 Radiomics features signature developed and used in the FCHQ analysis was applied to the other training data sets for calibration. Then, its performance was validated in the four validation sets. Area under the receiver operating characteristic curve (AUC) and AUC’s 95% confidence interval (CI) were used to indicate classification performance. The signature (AUC [95CI]) used temporal decrease in tumor spatial heterogeneity plus boundary infiltration to successfully predict sensitivity to anti-EGFR therapy (FCHQ [A], FCSD [B]) but failed with chemotherapy (FHQ [C], FSD [D]). F = FOLFIRI; FC = FOLFIRI+cetuximab; HQ= High computed tomography quality; SD = Standard computed tomography quality.

