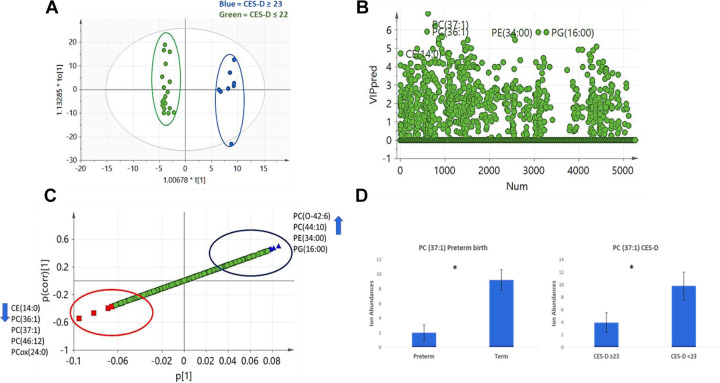
Figure 1.
Lipidomic profiles and depressive symptoms (DS). (A) Orthogonal projections to latent structures discriminant analysis (OPLS-DA) score plot showed clear separation between women with Center for Epidemiologic Studies Depression Scale (CES-D) scores ≥23, which have been correlated with DS, and the women with CES-D scores ≤22. Blue = CES-D ≥ 23, green = CES-D ≤22. (B) DS model predicted variable importance in projection (VIP) scatter plot showing lipids with high VIP scores. (C) S-plot of lipids identified to be related to DS. Blue triangles indicate lipid species higher with CES-D score ≥23 and red squares indicate lipid species lower with CES-D ≥ 23. (D) PC(37:1) levels in preterm birth (PTB) and DS models. Values represent mean, and error bars shows standard error of the mean (*p value < .05, Student’s t test).

