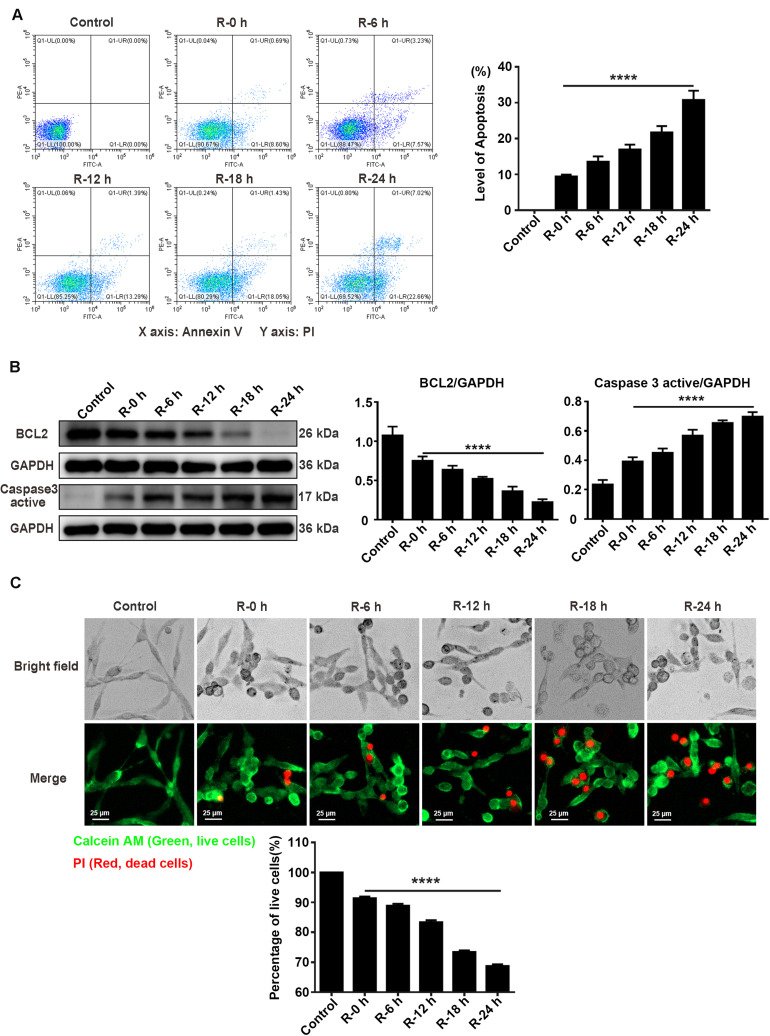
FIGURE 3.
The apoptosis level and percentage of live cells at different time points of reperfusion under OGD/R injury condition in PC12 cells. (A) Apoptosis levels in PC12 cells at 0, 6, 12, 18, and 24 h of reperfusion after 6 h of OGD stimulation. Annexin V-FITC/PI double staining assay by the flow cytometry was used to detect the dynamic change of apoptosis levels. A total of 10,000 cells were counted for each flow cytometry analysis. ****, compared with R-0 h group; P < 0.0001. X-axis: Annexin V; Y-axis: PI. (B) BCL2 and Caspase 3 active protein expression at different time points of reperfusion. The western blotting assay was used to detect the protein expression BCL2 and Caspase 3 active at different time points (0, 6, 12, 18, and 24 h) of reperfusion after 6 h of OGD stimulation. ****, compared with R-0 h group; P < 0.0001. (C) The percentage of live cells at different time points of reperfusion under OGD/R injury condition. Live/Dead cell staining was used to measure the percentage of live cells at different time points of reperfusion. Cells were stained with Calcein AM (green; live cells) and PI (red; dead cells). ****, compared with R-0 h group; P < 0.0001. Scale bars: 25 μm.

