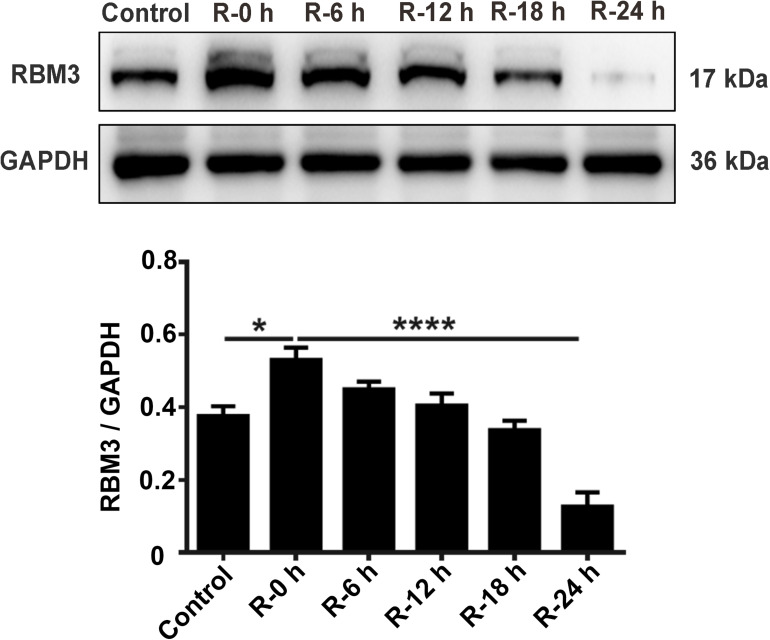
FIGURE 4.
Expression levels of RBM3 in PC12 cells under OGD/R stimulation. Total protein was extracted from PC12 cells at different time points of reperfusion (0, 6, 12, 18, and 24 h) after 6 h of OGD stimulation. Western blot analysis was used to detect RBM3 expression. *, compared with R-0 h group; P < 0.05; ****, compared with R-0 h group; P < 0.0001.

