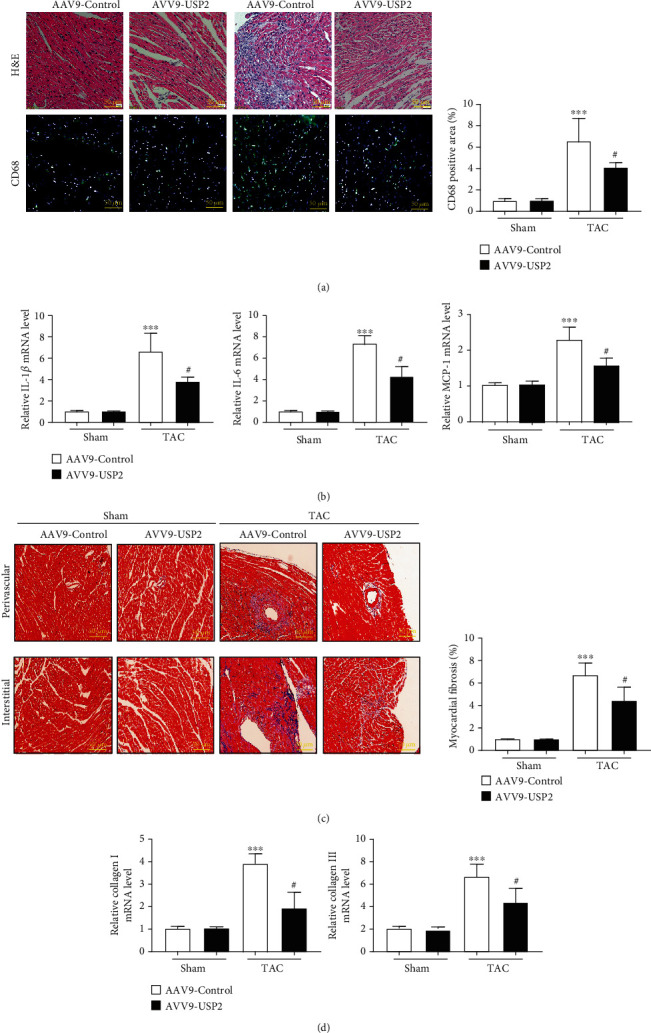
Figure 4.

Overexpression of USP2 attenuated pressure overload-induced cardiac fibrosis and inflammation. (a) Representative images of H&E staining in the ventricular sections from AAV-Control or AAV-USP2-treated mice following sham or TAC (upper). Representative images of immunofluorescence staining in ventricular sections with CD68 antibody (lower). Quantification of CD68-positive cell areas (right panel). (b) mRNA levels of IL-1β, IL-6, and MCP-1 in the hearts from AAV-Control or AAV-USP2-treated mice following sham or TAC. (c) Representative images of Masson staining in the ventricular sections, showing myocardial fibrosis, and the quantification of the relative fibrotic area. (d) mRNA levels of collagen I and collagen III in heart sections. All values are presented as the relative value of the sham (AAV9-Control) value. ∗P < 0.05 and ∗∗P < 0.01 (AAV9-Control plus TAC vs. AAV9-Control plus sham); #P < 0.05 and ##P < 0.01 (AAV9-Control plus TAC vs. AAV9-USP2 plus TAC). n = 6/group.
