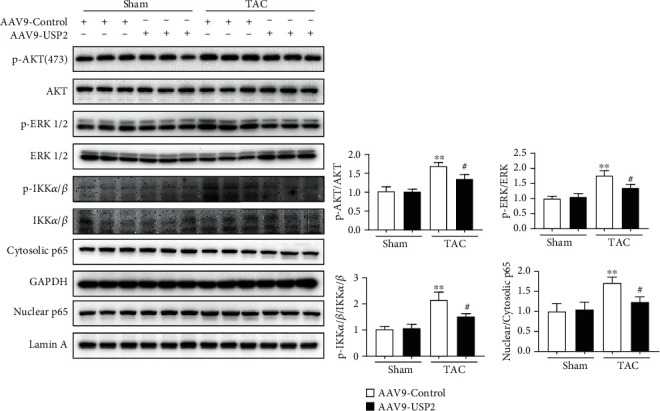
Figure 6.

Overexpression of USP2 on signaling pathways of AKT, p-ERK1/2, and p-IKKα/β. Representative Western blot analyses of USP2, p-AKT, AKT, p-ERK1/2, ERK1/2, p-IKKα/β, IKKα/β, nuclear p65, cytosolic p65, Lamin A, and GAPDH in heart tissues from AAV9-Control or AAV9-USP2-treated mice following sham or TAC. All values are presented as the relative value of the sham (AAV9-Control) value. ∗P < 0.05 and ∗∗P < 0.01 (AAV9-Control plus TAC vs. AAV9-Control plus sham); #P < 0.05 and ##P < 0.01 (AAV9-Control plus TAC vs. AAV9-USP2 plus TAC); $$P < 0.01 (AAV9-Control plus sham vs. AAV9-USP2 plus sham). n = 3/group.
