
Figure 13.
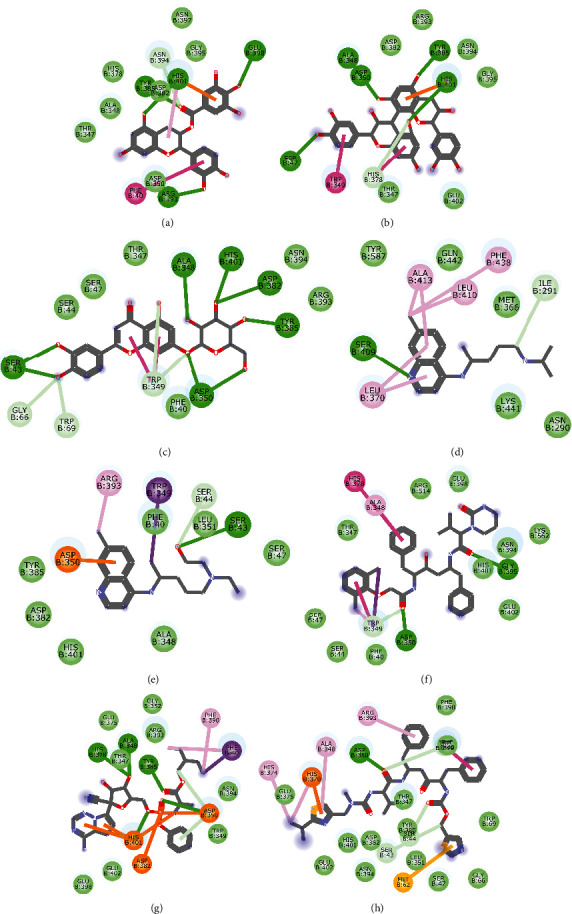
2D representation of (a) 3-galloylcatechin, (b) proanthocyanidin B1, (c) luteolin 7-galactoside, (d) chloroquine, (e) hydroxychloroquine, (f) lopinavir, (g) remdesivir, and (h) ritonavir in the binding pocket of ACE2. Hydrogen and π bonds are depicted as green and any other coloured (purple, magenta, orange, turquoise blue, pink, and yellow) lines, while Van der Waal interactions appear as light green circles.