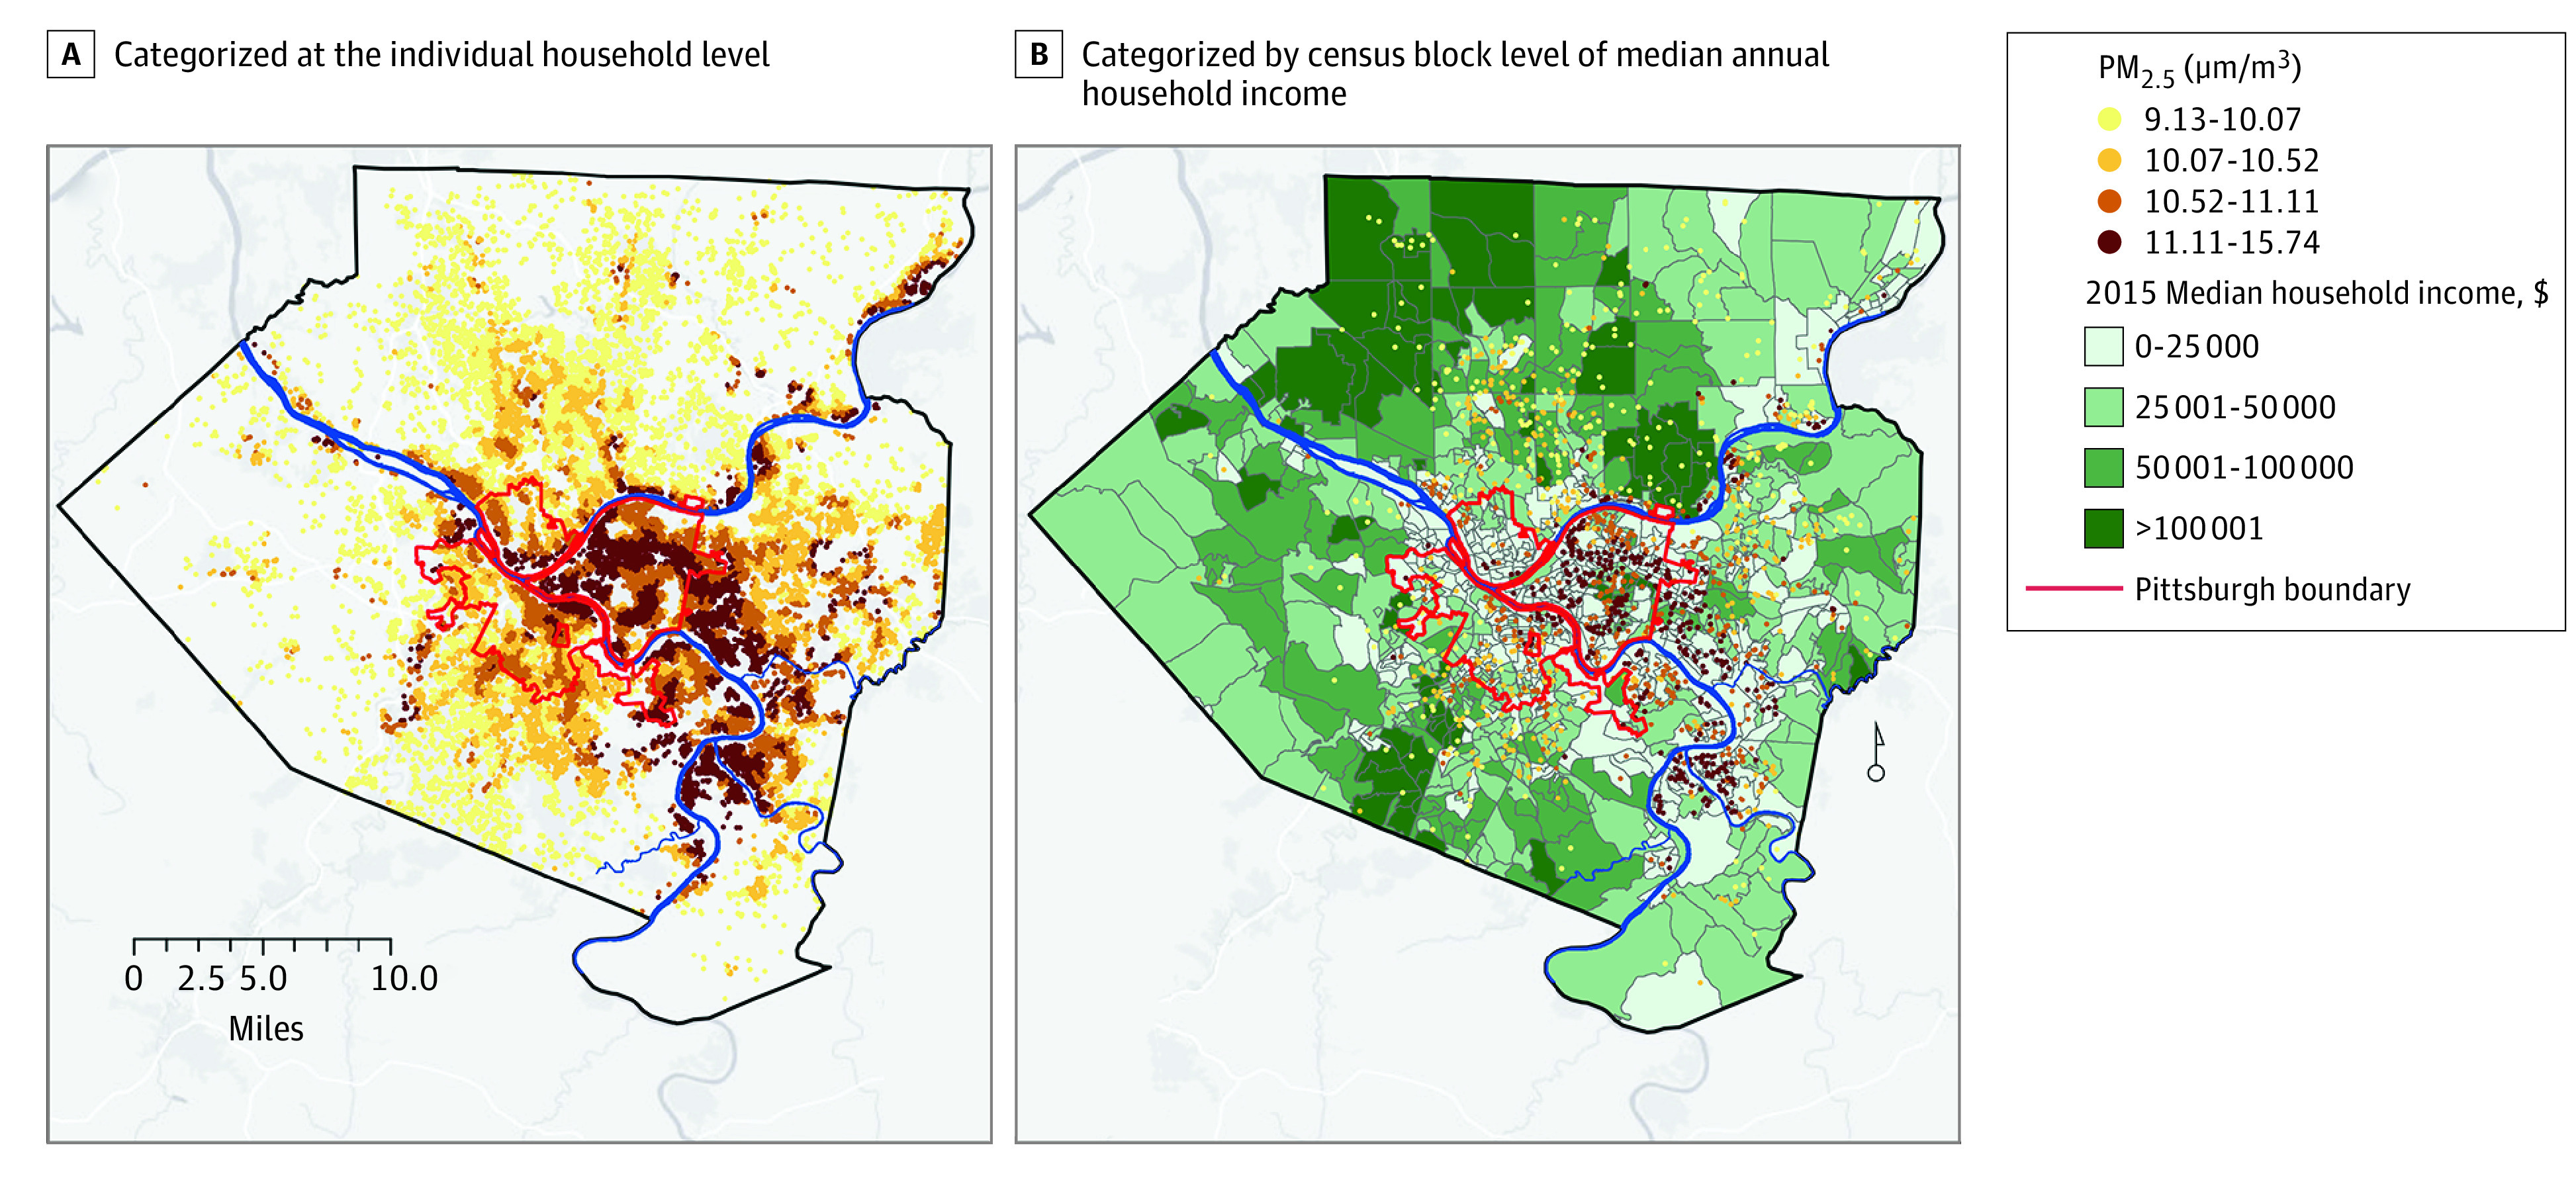
Figure 2. Map of Allegheny County, Pennsylvania .

The map shows fine particulate matter measuring 2.5 μm or less (PM2.5) concentration, categorized by quartile at the residence level for (A) each cohort participant (n = 31 414) and (B) for each cohort participant with a stroke event (n = 1546) and by census block level of median household income. PM2.5 values appear to overlap because of rounding.
