Figure 3.

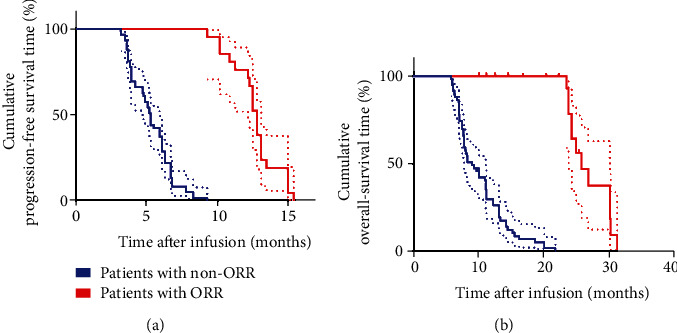
Kaplan–Meier curves for PFS and OS of patients with ORR (CR+PR), N = 20 and non-ORR, N = 60. (a) The PFS curve of patients with ORR and non-ORR. (b) The OS curve of patients with ORR and non-ORR.

Kaplan–Meier curves for PFS and OS of patients with ORR (CR+PR), N = 20 and non-ORR, N = 60. (a) The PFS curve of patients with ORR and non-ORR. (b) The OS curve of patients with ORR and non-ORR.