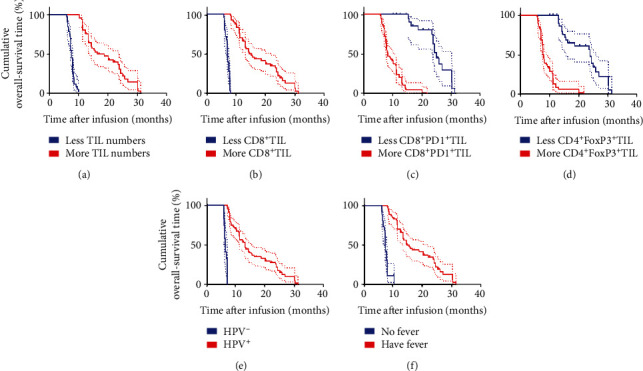
Figure 5.

Univariate analyses of more infusion (TIL numbers and CD8+ TIL percentage), less infusion (CD8+PD1+ TIL percentage and CD4+FoxP3+ TIL percentage), and HPV status and having fever or not after immunotherapy based on OS. OS curve for: (a) patients with more TIL numbers (≥50 × 109, red line) and less TIL numbers (<50 × 109, blue line); (b) patients with more CD8+ TIL (≥60%, red line) and less CD8+ TIL (<60%, blue line); (c) patients with more CD8+PD1+ TIL (≥10%, red line) and less CD8+PD1+ TIL (<10%, blue line); (d) patients with more CD4+FoxP3+ TIL (≥20%, red line) and less CD4+FoxP3+ TIL (<20%, blue line); (e) patients with HPV+ (red line) and HPV− (blue line); and (f) patients having fever (red line) and no fever (blue line) after immunotherapy.
