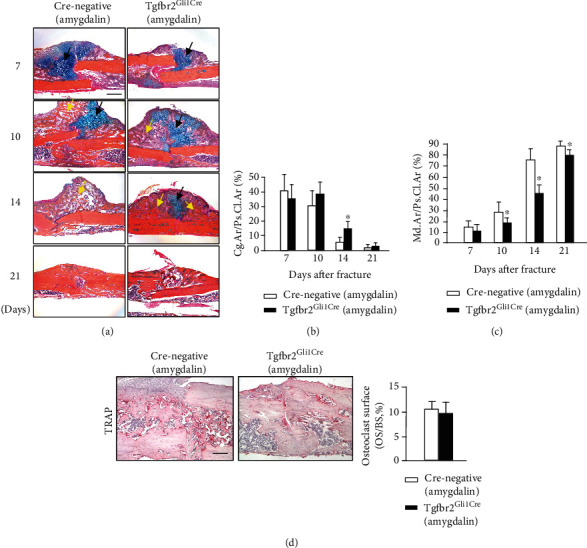
Figure 7.

(a) Histological images of amygdalin-treated Tgfβr2Gli1Cre and Cre-negative control mice stained with Alcian blue/Hematoxylin and Eosin (ABH). Black arrows designate chondrocytes; yellow arrows highlight woven bone. Scale bar = 200 μm. (b, c) The cartilage area of the callus (%, Cg.Ar/http://Ps.Cl.Ar) and newly formed woven bone (%, Md.Ar/http://Ps.Cl.Ar) were quantified at days 7, 10, 14, and 21 in amygdalin-treated Tgfβr2Gli1Cre and Cre-negative control mice. (d) Tartrate-resistant acid phosphatase (TRAP) staining and quantification of osteoclast surface per bone surface (Oc. S./BS) of sections from amygdalin-treated Tgfβr2Gli1-Cre and Cre-negative mice (day 14). Scale bar = 100 μm. Data are presented as mean ± standard deviation (SD). ∗P < 0.05, n = 6.
