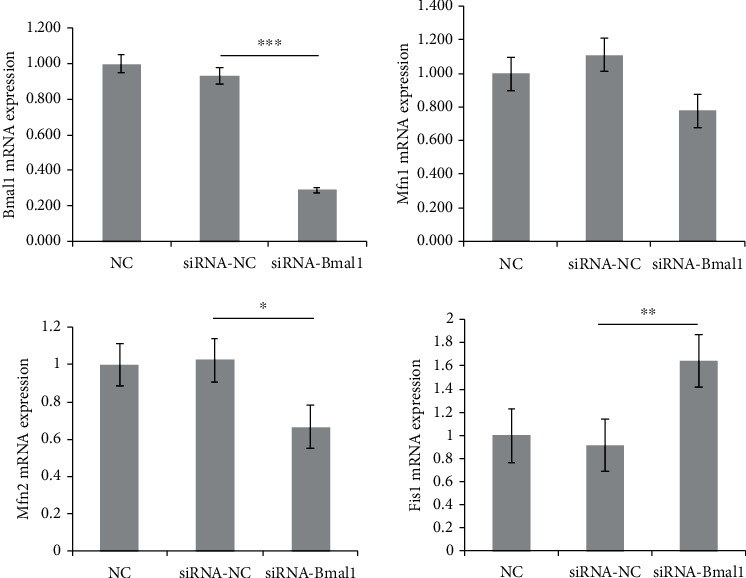
Figure 5.

Bmal1 deficiency in β-cells altered core genes related to mitochondrial dynamics. Bmal1, mitofusin 1, mitofusin 2, and fission 1 mRNA were analyzed by qPCR. Expression levels were normalized to GAPDH mRNA, and each bar represents the mean ± SE of 3 individual experiments. NC: normal control group; siRNA-NC: INS-1 cells treated with negative control siRNA; siRNA-Bmal1: INS-1 cells treated with Bmal1 siRNA. A p value < 0.05 is considered as statistically significant. ∗p < 0.05, ∗∗p < 0.01, and ∗∗∗p < 0.001.
