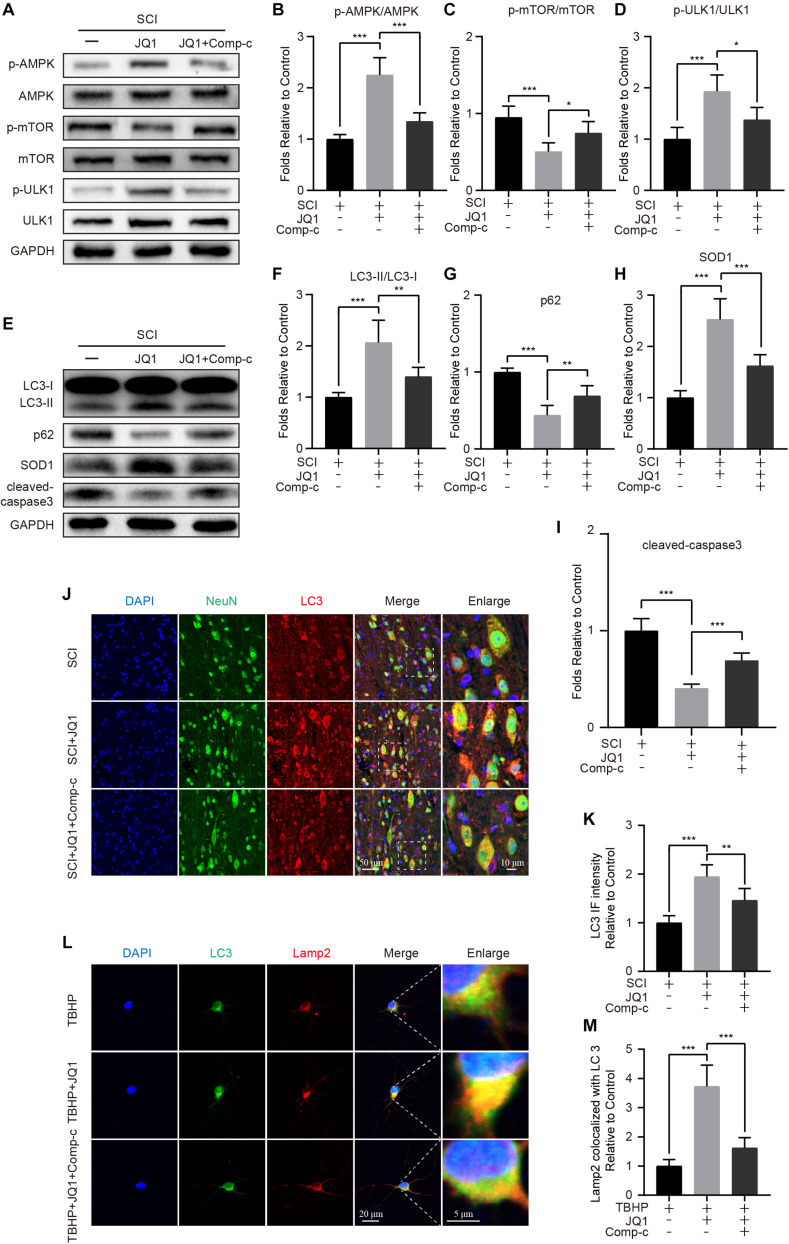
FIGURE 8.
Compound c treatment inhibits JQ1 induced autophagy activation. (A–D) Western blotting and quantification of p-AMPK, AMPK, p-mTOR, mTOR, p-ULK1, and ULK1 in each group of mice at 3 days after SCI, n = 5. (E–I) Western blotting and quantification of LC3, p62, SOD1 and cleaved caspase-3 in each group of mice at 3 days after SCI, n = 5. (J,K) Immunofluorescence staining for the co-localization of LC3 (red) and NeuN (green) and quantitative analysis in the each group of mice at 3 days after SCI, n = 5. Scale bar = 50 μm, scale bar (enlarged) = 10 μm. (L,M) Immunofluorescence staining for the co-localization of LC3 (green) and Lamp2 (red) and quantitative analysis in the each group of mice, n = 10. Scale bar = 20 μm, scale bar (enlarged) = 5 μm. The mice were treated with or without JQ1 (50 mg/kg) and Compound c (10 mg/kg) and divided into groups as followed: SCI group, SCI + JQ1 group and SCI + JQ1 + Compound c group. The neurons were treated with or without TBHP (50 μM), JQ1 (200 nM) and Compound c (10 μM), and divided into TBHP group, TBHP + JQ1 group and TBHP + JQ1 + Compound c group, respectively. GAPDH was the loading control. *P < 0.05, **P < 0.01, ***P < 0.001. Data were presented as means ± SD.

