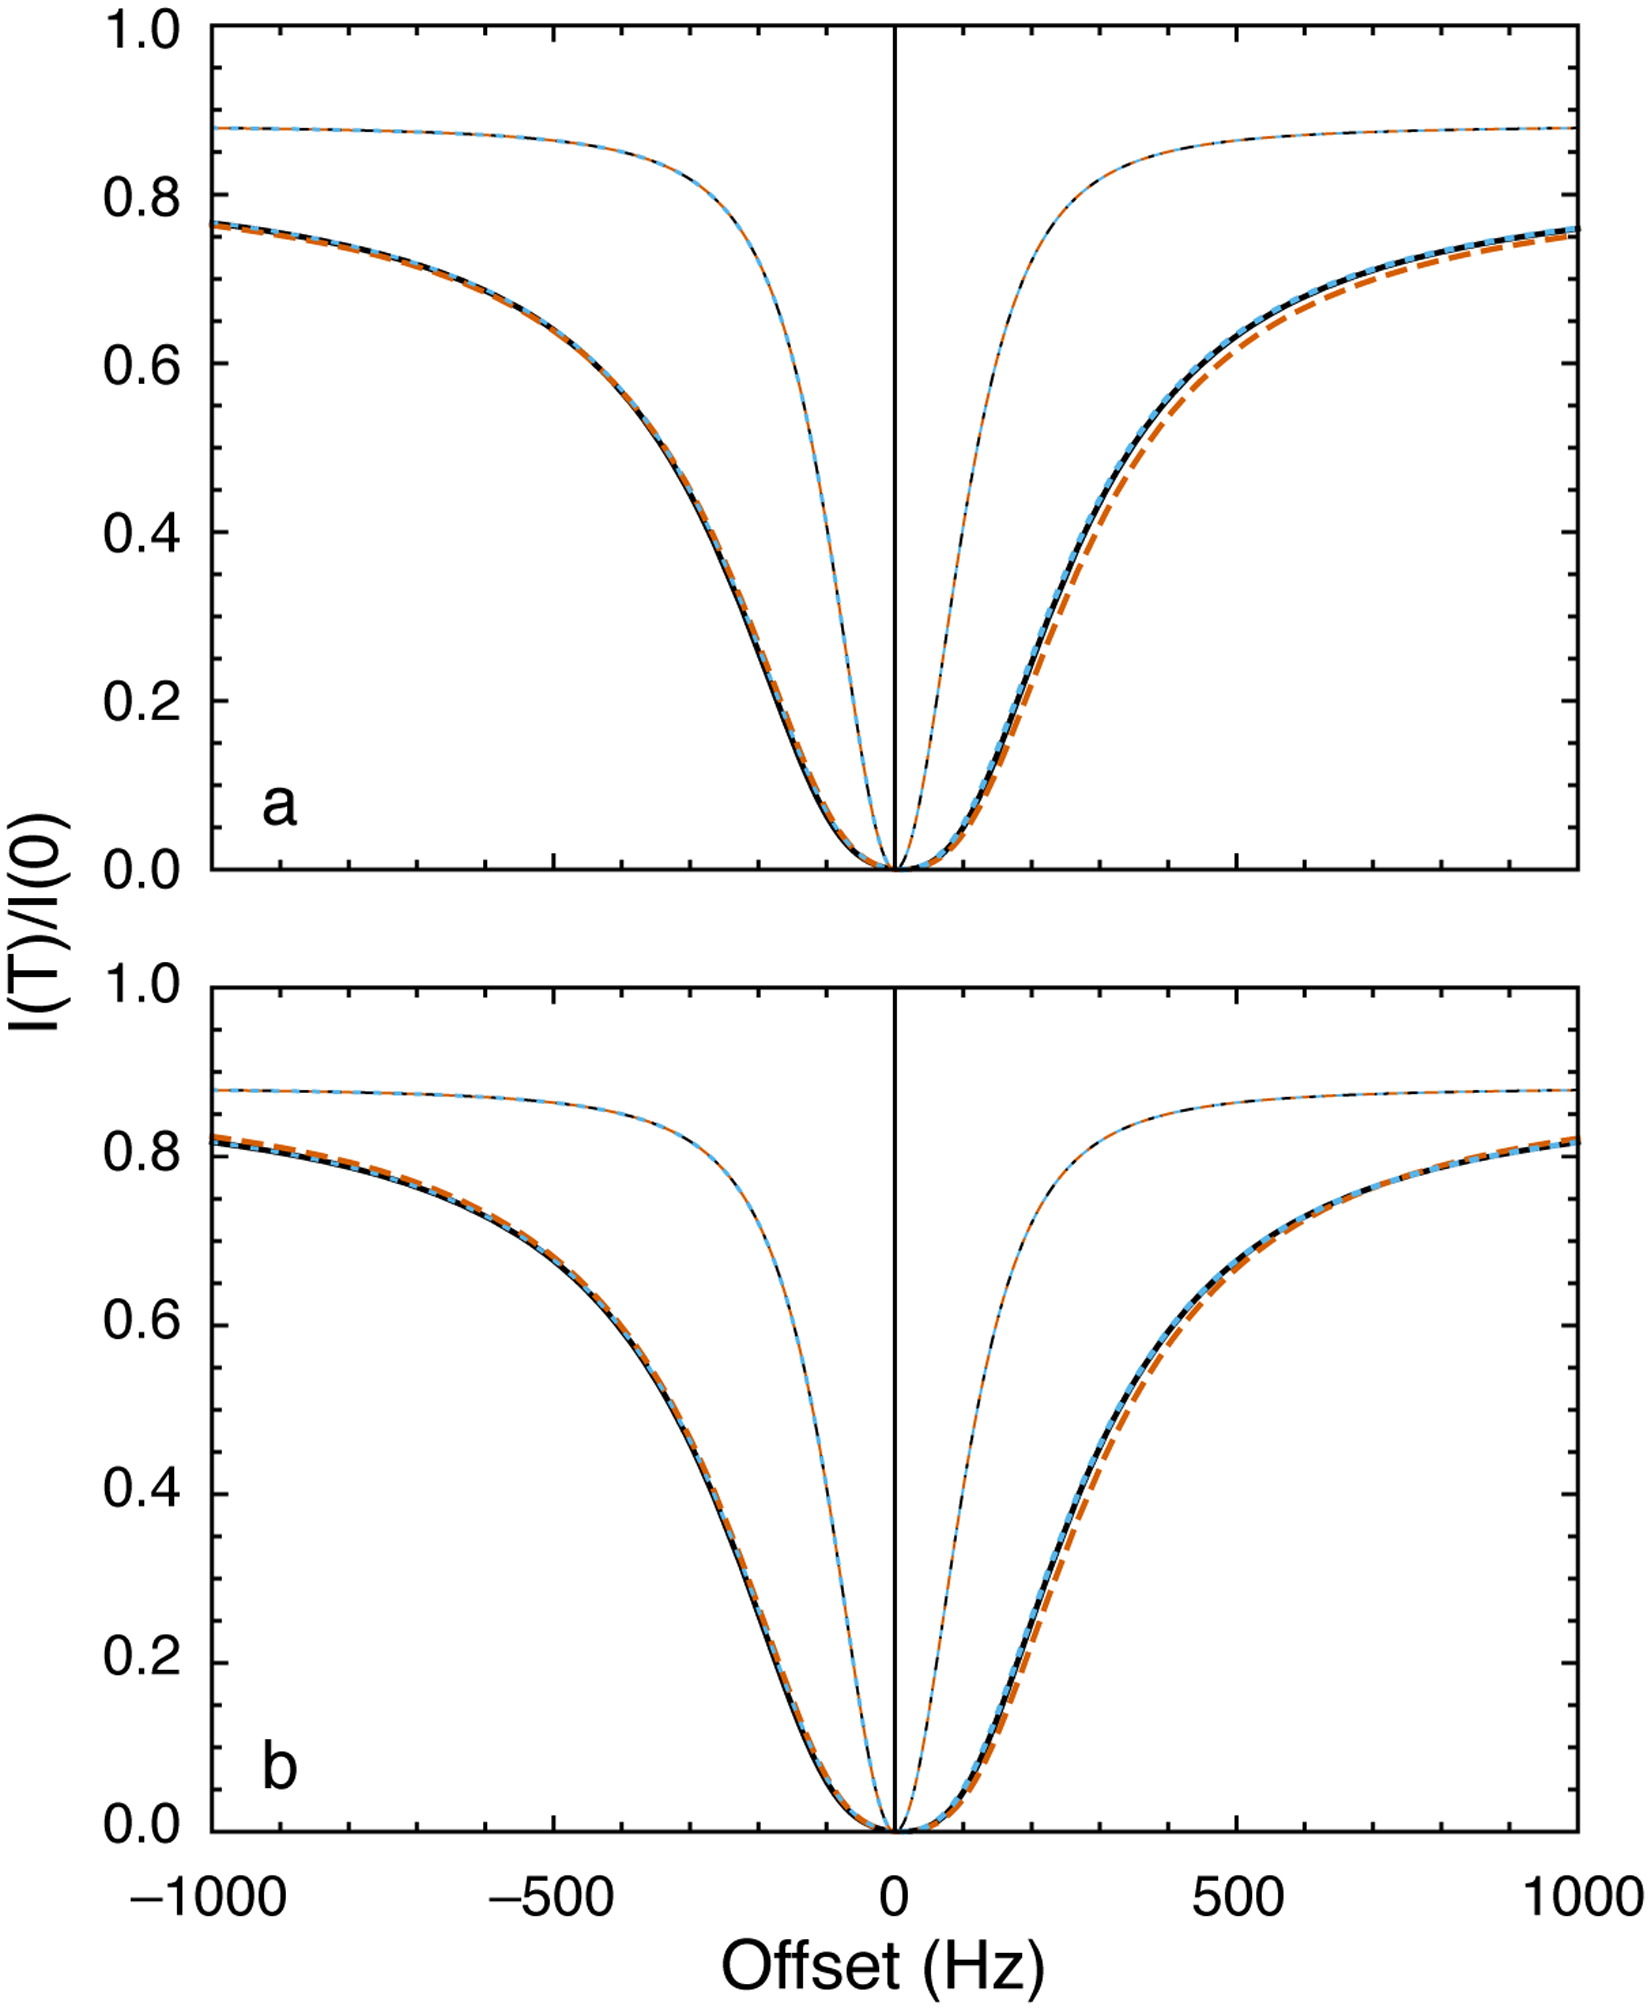
Figure 12.

DEST profiles. (a) Parameters used for calculations were Δω21/2π = 200 Hz, ω1/2π = 200 Hz, kex = 1200 s−1, R11 = R12 = 2.5 s−1, R21 = 6 s−1, and ΔR21 = 20,000 s−1. Thick lines show calculations for p2 = 0.05 and thin lines show calculations for p2 → 0. (black, solid) Numerical integration of the Bloch-McConnell equations, (blue, dotted) Baldwin-Kay equation,(Baldwin & Kay, 2013) and (orange, dashed) Eqs. 40 and 42. (b) Results are calculated with ΔR21 = 200,000 s−1 and other parameters as in (a). Lines are drawn as in (a) except that the dashed orange line is the limit of Eq. 42 as as ΔR21 → ∞.
