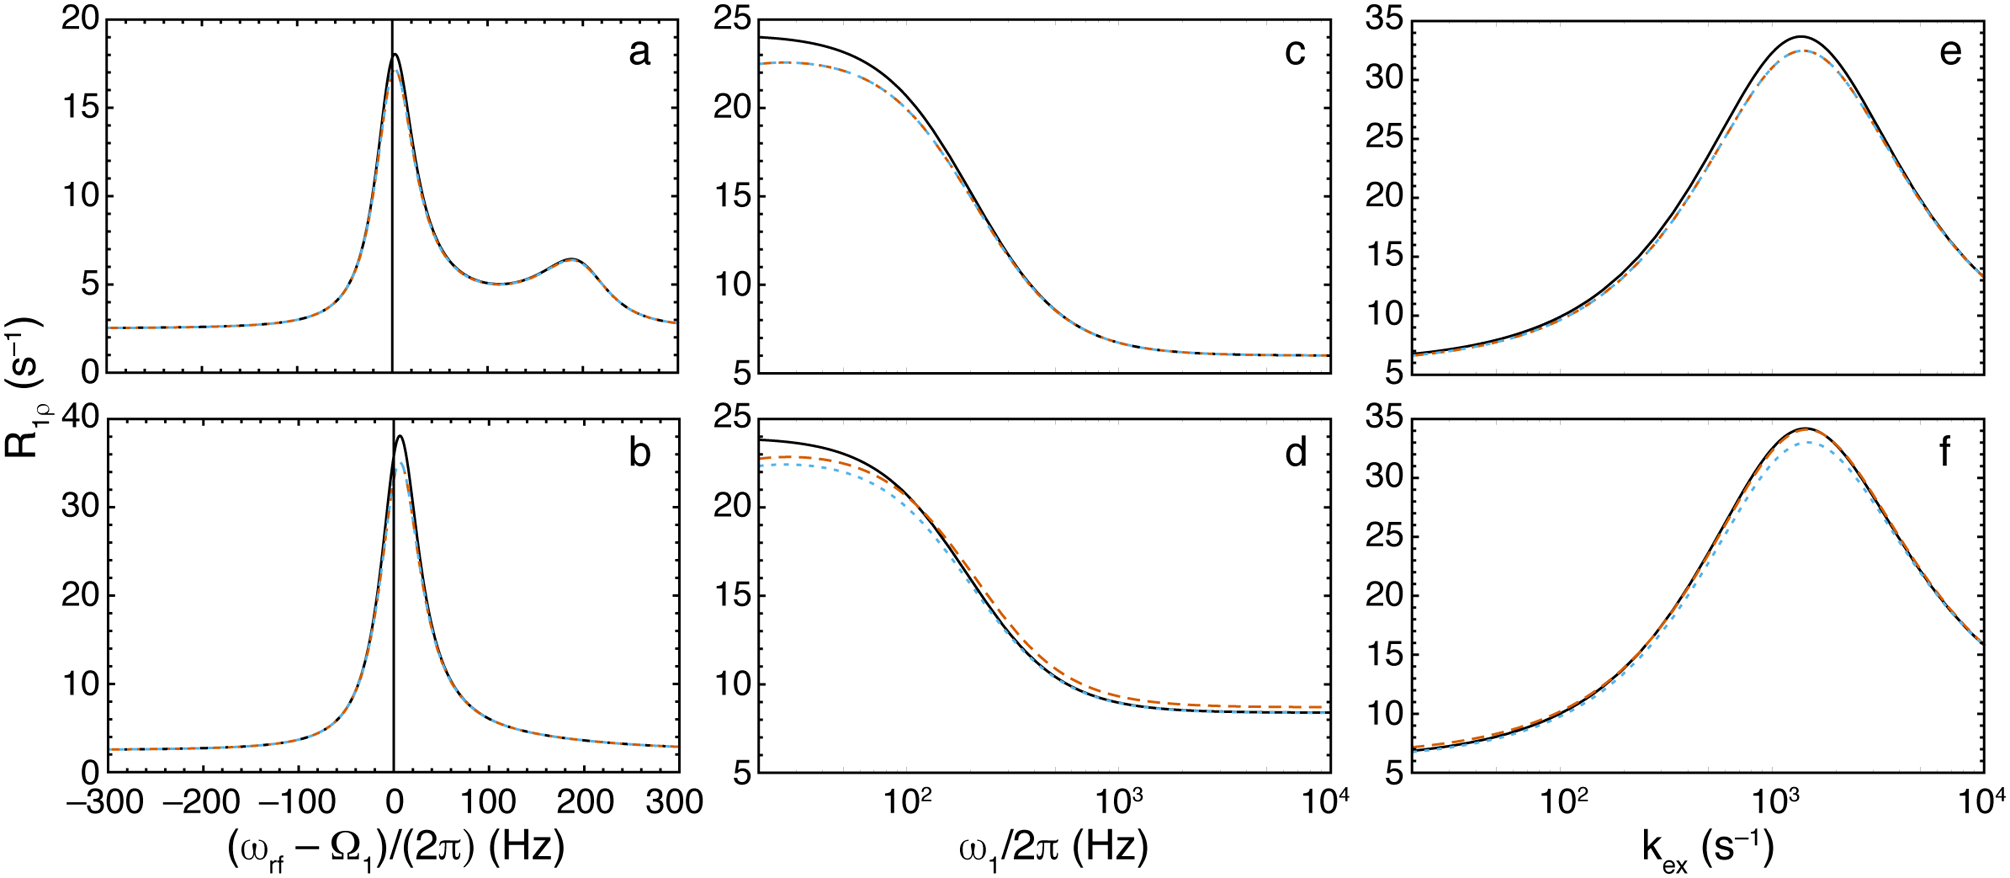
Figure 5.

R1ρ relaxation dispersion curves for 2-site chemical exchange. (black, solid) Numerical eigenvalue, (orange, dashed), Trott-Palmer expression, Eq. 30, (blue, dotted), Eq. 32. Parameters common to all calculations are ω21/(2π) = 200 Hz, p2 = 0.05, and R11 = R12 = 2.5 s−1. Other parameters are (a) kex = 250 s−1, ω1/(2π) = 25 Hz, R21 = R22 = 6 s−1; (b) as in (a) except kex = 1200; (c) ωrf/(2π) = 0 Hz, kex = 400 s−1, R21 = R22 = 6 s−1; (d) as in (c) except R22 = 60 s−1; (e) ωrf/(2π) = 0 Hz, ω1/(2π) = 100 Hz, R21 = R22 = 6 s−1; and (f) as in (e), except R22 = 60 s−1.
