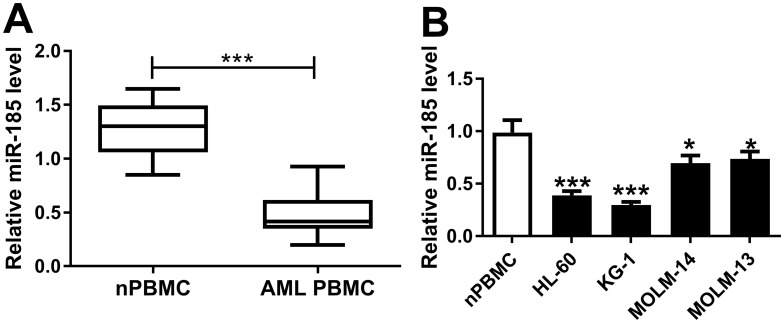
Figure 4.
Expression of miR-185 in AML specimens and cells. (A and B) miR-185 expression level was detected by RT-qPCR analysis (2−ΔΔCt, normalized to U6) in (A) AML PBMC (n=23) compared with nPBMC (n=12), and (B) human HL-60, KG-1, MOLM-14, and MOLM-13 cells vs nPBMC. The error bars represent the mean±SEM of three independent experiments. *P<0.05, and ***P<0.001.

