
Figure 3 .
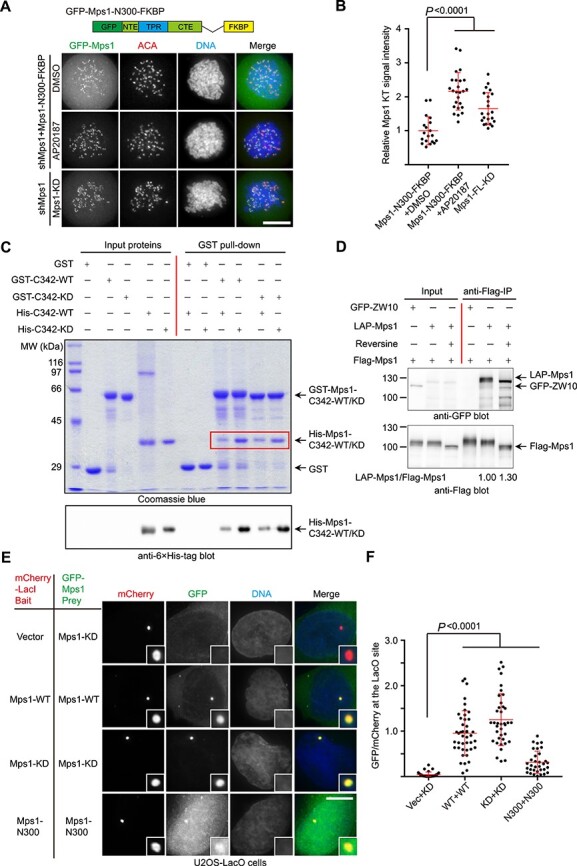
Mps1 C-terminal fragment mediates Mps1 dimerization. (A) Representative immunofluorescence images of HeLa cells transfected with shMps1 and shMps1-resistant GFP-Mps1N300-FKBP construct as indicated. After 36 h of transfection, cells were treated with nocodazole plus MG132 for 1 h. One group of cells was treated with AP20187 for 30 min. Then cells were fixed and co-stained for ACA (red) and DNA (blue). Scale bar, 10 μm. (B) Bar graph illustrating kinetochore intensity of GFP-Mps1N300-FKBP fusion protein in cells treated as in A. Bars represent the mean kinetochore intensity (±SD) normalized to the values of DMSO group. Each dot represents one cell (>30 cells from three independent experiments). Student’s t-test was used to calculate P-values. (C) GST, GST-Mps1C342-WT, or Mps1C342-KD-bound agarose beads were used as affinity matrices to absorb purified 6× His-tagged Mps1C342-WT or Mps1C342-KD fusion protein. Pull-downs were analyzed by SDS-PAGE and western blotting using anti-6× His tag antibody. (D) 293T cells were co-transfected with Flag-Mps1 together with GFP-ZW10 (negative control) and LAP-Mps1, respectively. After 24 h, one group of cells was treated with reversine for 2 h. The cells were collected and lysed, and immunoprecipitation was carried out using anti-Flag M2 beads. Immunoprecipitation samples were resolved by western blotting using anti-GFP antibody and anti-Flag antibody, respectively. The normalized ratio of LAP-Mps1 signal to Flag-Mps1 signal is shown below in lanes 5 and 6. (E) Representative immunofluorescence images of U2OS-LacO cells co-expressing different mCherry-LacI-Mps1 (bait) and GFP-Mps1 (pray) constructs as indicated. After 24 h of transfection, cells were fixed and stained with DAPI. The boxed areas are shown magnified in the right panels. Scale bar, 10 μm. (F) Bar graph illustrating intensity of different GFP-Mps1 proteins colocalized with different mCherry-LacI baits as indicated in E. Bars represent the mean intensity (±SD) normalized to the values of Mps1-WT plus Mps1-WT (WT+WT) group. Each dot represents one cell (>30 cells from three independent experiments). Student’s t-test was used to calculate P-values.