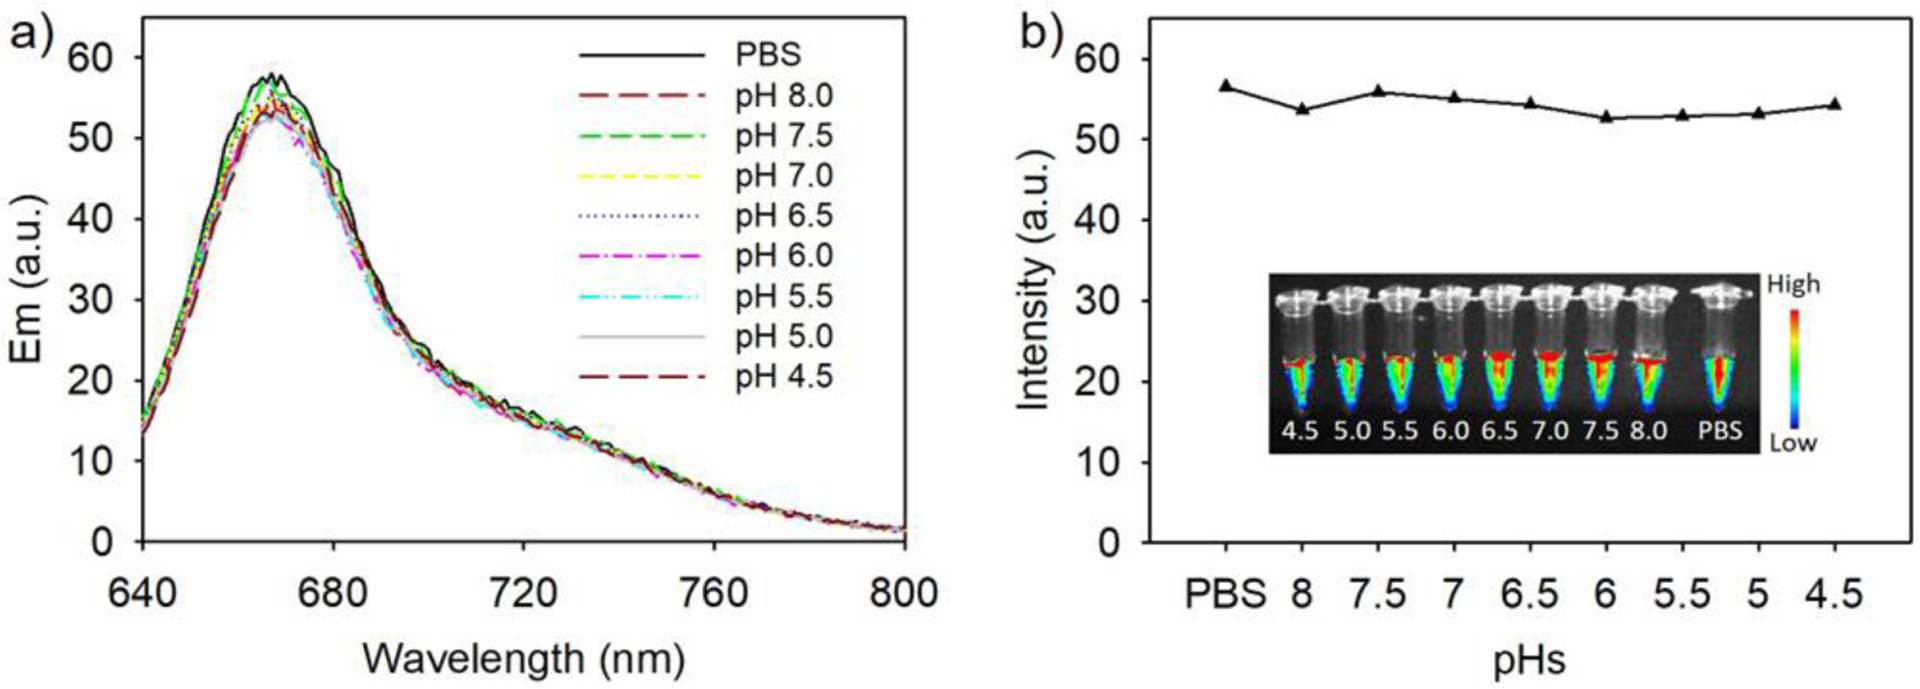
Figure 3.

Fluorescence stability of fluorescent protein nanoparticles at various pH. a) Fluorescence of fluorescent protein nanoparticles at pH 4.5–8.0. ‘PBS’ is pH 7.4. Fluorescence spectra were obtained with excitation at 620 nm. b) Plot of the fluorescence intensities at maximum fluorescence emission. Inset: Fluorescence image of the fluorescent protein nanoparticles at different pH values in Eppendorf tubes. Fluorescence images were obtained with excitation at 630 nm and a 700 nm long pass filter.
