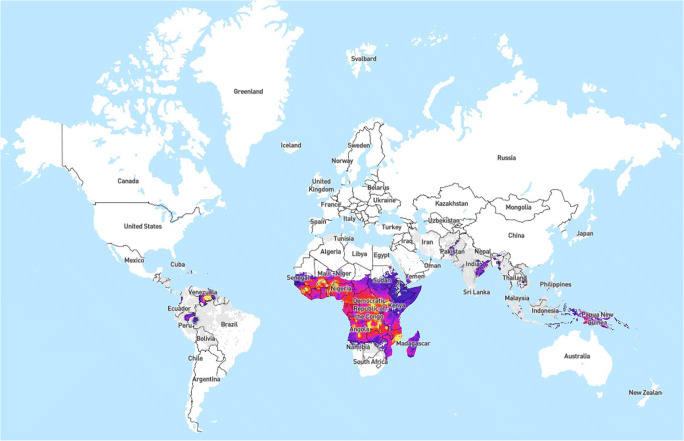
Fig. 1.
Global incidence of P. falciparum. Time-aware mosaic data set showing predicted all-age incidence rate (clinical cases per 1000 population per annum) of Plasmodium falciparum malaria for each year. Colors: one linear scale between rates of zero and 10 cases per 1000 (gray shades) and a second linear scale between 10 and 1000 (colors from purple to yellow). Malaria Atlas Project: WHO Collaborating Centre. Explorer Map - Plasmodium falciparum Incidence. No changes made to the map. Legend represented as is from map. Image located at: https://malariaatlas.org/explorer/#/. Available through open access via the Creative Commons Attribution 3.0 Unported License accessible through: creativecommons.org/licenses/by/3.0/. Disclaimer: Authors of this paper were not involved in the making of this map. This image was made through the Malaria Atlas Project. See open access attribution information above for details on accessing the map

