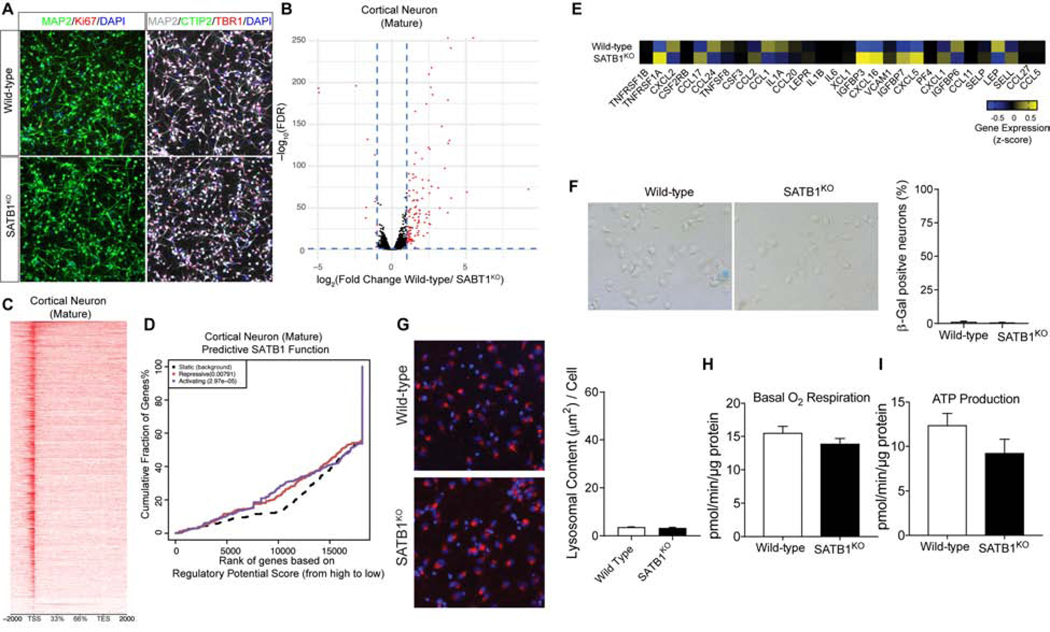
Figure 5. CTX Neurons lacking SATB1 do not have a Senescence Phenotype.
(A) Triple immunolabeling of cortical shows that both WT as well as SATB1KO neurons express the essential markers for cortical neurons. Scale bar: 50 μm. (B) RNA-Seq expression profile comparing WT vs. SATB1KO CTX neurons (n=4). Red dots indicate significantly changed genes (FDR < 0.05, > ±2-fold expression change). (C) Genome-wide heatmap of SATB1-ChIP-Seq experiment of CTX neurons (ChIP-Seq experiments performed in 4 independent experiments). (D) BETA plot of combined computational analysis of SATB1-ChIP-Seq and RNA-Seq data of CTX neurons. Black line: static background, red line: repressive function, blue line: activating function. (E) Heatmap of genes associated with SASP. (F) Representative microscopic overview images of WT and SATB1KO neurons subjected to X-Gal staining (n=6). Blue cells are senescence cells. Bar graph shows low levels and no change in numbers of SA-βGal positive cells. Data are represented as mean ± SEM. (G) Representative confocal images of LysoTracker staining of WT and SATB1KO CTX neurons. Bar graph shows no significant change of lysosomal content in SATB1KO CTX neurons. n=8, data are represented as mean ± SEM. Analysis of cellular respiration identified no alteration of basal respiration (H) and ATP production (I) in SATB1KO CTX neurons. n=10, data are represented as mean ± SEM. See also Figure S5.

