
Figure 3.
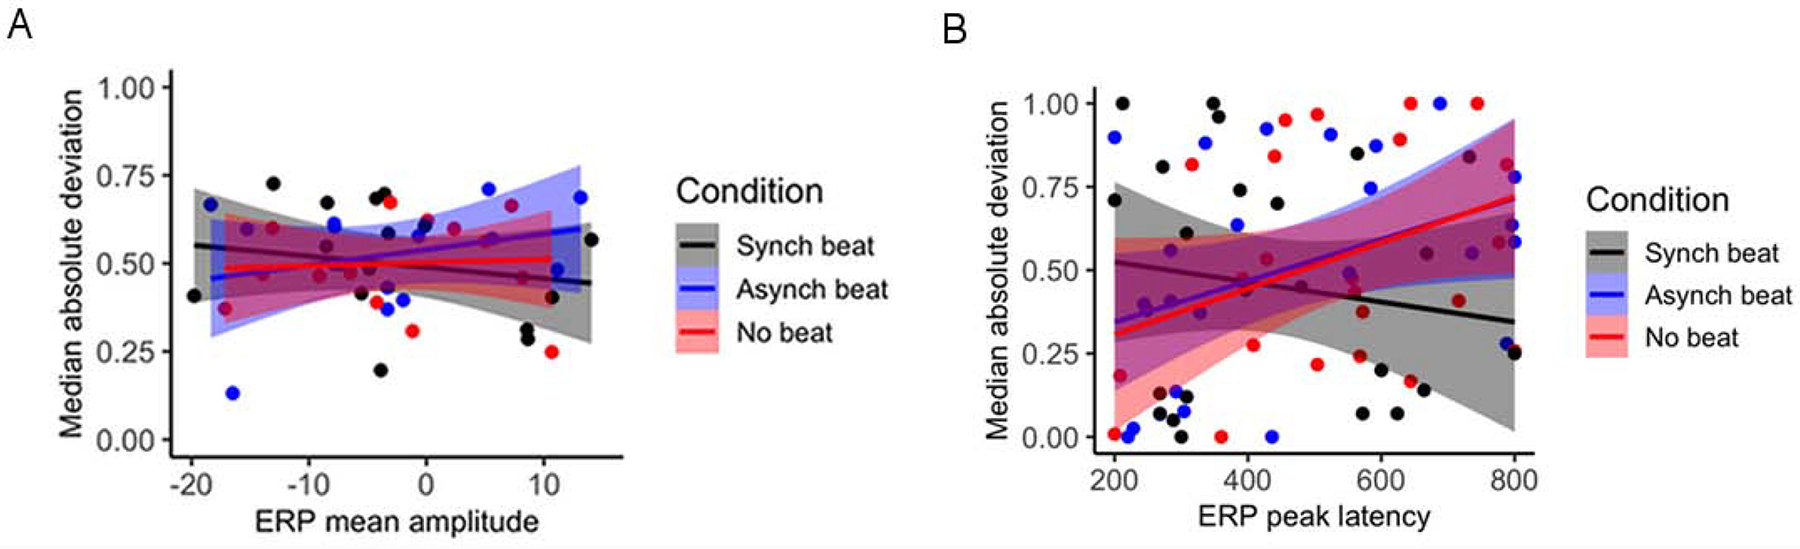
Relationships Between Mean ERP Amplitude and Peak ERP Latency and Measures of Trial-By-Trial ERP Variability in the 200–800 ms Time Window by Participant for Beat Gesture Relative to Pitch Accented CWs: (A) Normalized MAD of Peak Amplitude by ERP Mean Amplitude; (B) Normalized MAD of Peak Latency by ERP Peak Latency