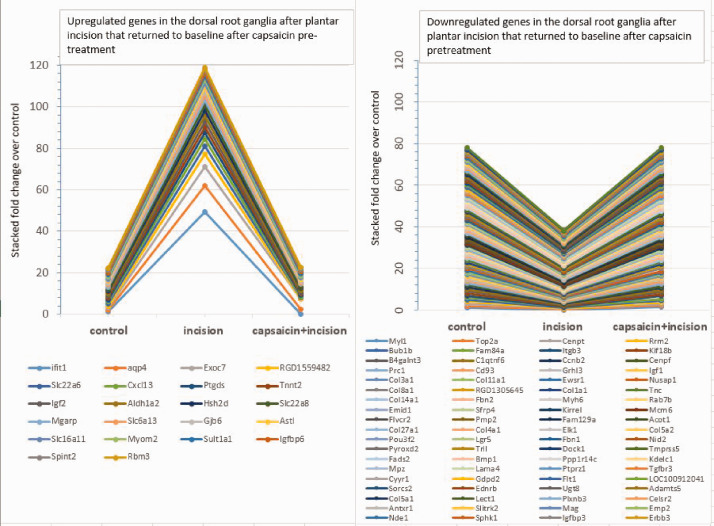
Figure 7.
Data presented in figure 2 are shown as stacked percentage chart showing degree of expression changes relative to the total changes in gene expression in dorsal root ganglia (DRG) following plantar incision. Left: upregulated genes; Right: downregulated genes.

