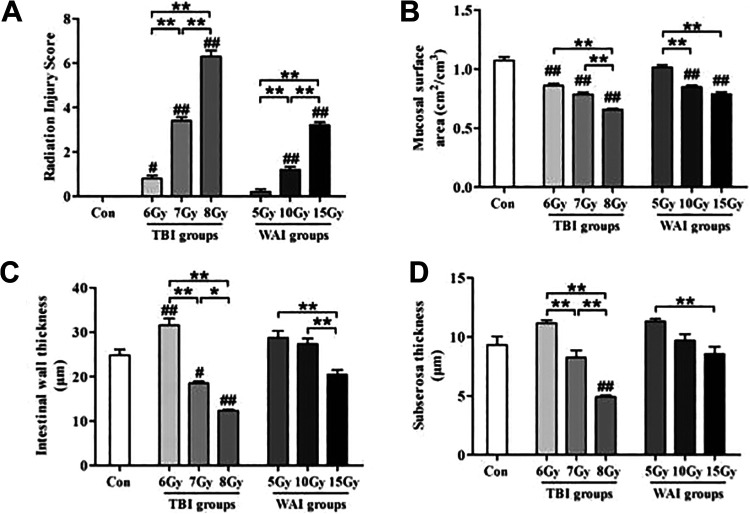
Figure 5.
Structural manifestations of radiation enteropathy (n = 6). The data were presented as the mean ± standard deviation of the 7 independent experiments. The differences were evaluated by a one-way analysis of variance (ANOVA). # P < 0.05 as compared with control group; ## P < 0.01 as compared with control group; * P < 0.05; ** P < 0.01.

