
Figure 4.
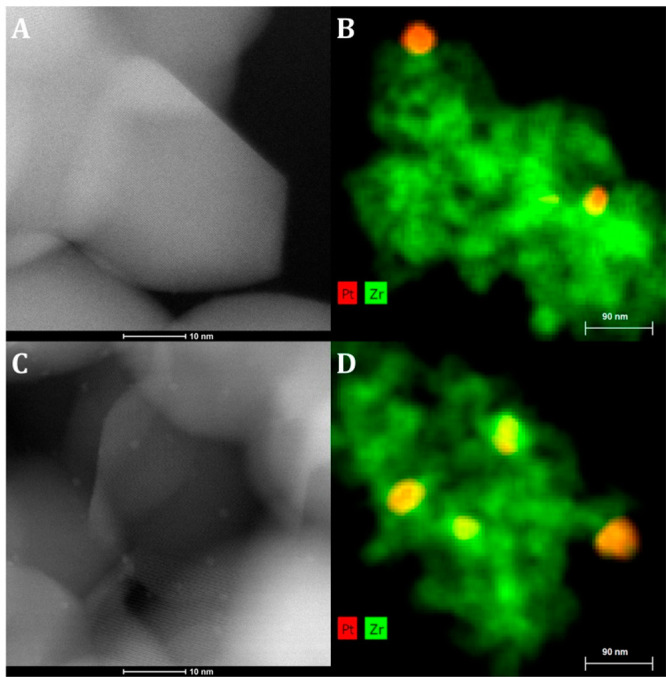
HAADF-STEM images (left) and EDX-mapping (right) of 2Pt/ZrO2 calcined at 800 °C (A and B, 2Pt/ZrO2-800) and the same material after reduction at 400 °C (C and D, 2Pt/ZrO2-800-R400). EDX-mapping: Zr: green; Pt: red.
Official websites use .gov
A
.gov website belongs to an official
government organization in the United States.
Secure .gov websites use HTTPS
A lock (
) or https:// means you've safely
connected to the .gov website. Share sensitive
information only on official, secure websites.
HAADF-STEM images (left) and EDX-mapping (right) of 2Pt/ZrO2 calcined at 800 °C (A and B, 2Pt/ZrO2-800) and the same material after reduction at 400 °C (C and D, 2Pt/ZrO2-800-R400). EDX-mapping: Zr: green; Pt: red.