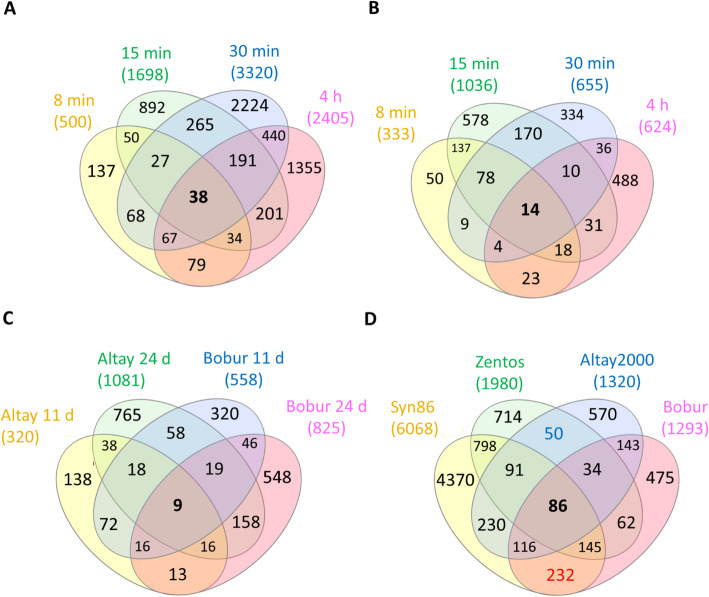
Fig. 3.
Venn diagrams of the salt-responsive genes in the contrasting genotypes studied. The total number of genes in each genotype and/or time point are shown above each diagram. (A) Diagram of the salt-responsive genes in Syn86 by time point; (B) diagram of the salt-responsive genes in Zentos by time point; (C) diagram of the salt-responsive genes in the two sampled days from the ionic stress phase; (D) diagram with the four genotypes. The blue number represents the genes shared by the tolerant genotypes, while the red number indicates the genes shared by the salt-susceptible

