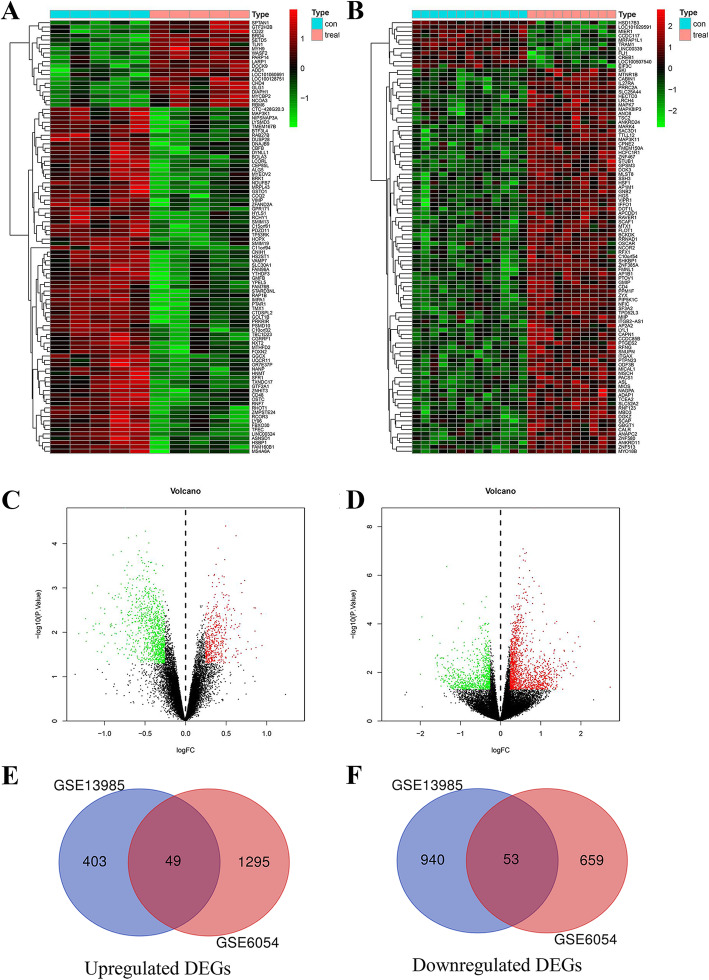
Fig. 1.
a Clustered heat map of DEGs between FH and control samples in GSE13985. b Clustered heat map of DEGs between FH and control samples in GSE6054. The abscissa represents different samples, and the ordinate represents different genes. The red boxes indicate up-regulated genes, and the green boxes indicate down-regulated genes. c The volcano plot shows the DEGs between FH and control samples in GSE13985. d The volcano plot shows the DEGs between FH and control samples in GSE6054. e The Venn diagram presents that there are a total of 49 upregulated genes that are simultaneously included in the 2 datasets. f The Venn diagram presents that there are a total of 53 downregulated genes that are simultaneously included in the 2 datasets. DEGs: Differentially Expressed Genes

