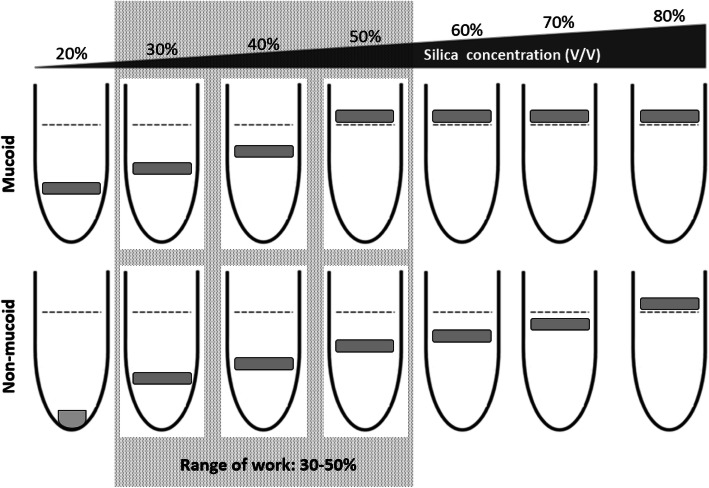
Fig. 2.
Validation of gradient composition. Schematic illustration of the method used to determine the optimal parameters of the gradient composition and the adequate range of work (box with dashed gray background). The range of work was determined by testing a panel of seven single silica concentrations (20–80% V/V). The validation was performed on three control strains (CAP-AB, HM-KP, ATCC 19606) and confirmed on six isolates selected randomly from the sample. The grey square illustrates a band of bacterial cells following centrifugation. The dashed line represents the upper liquid level of the silica sample

