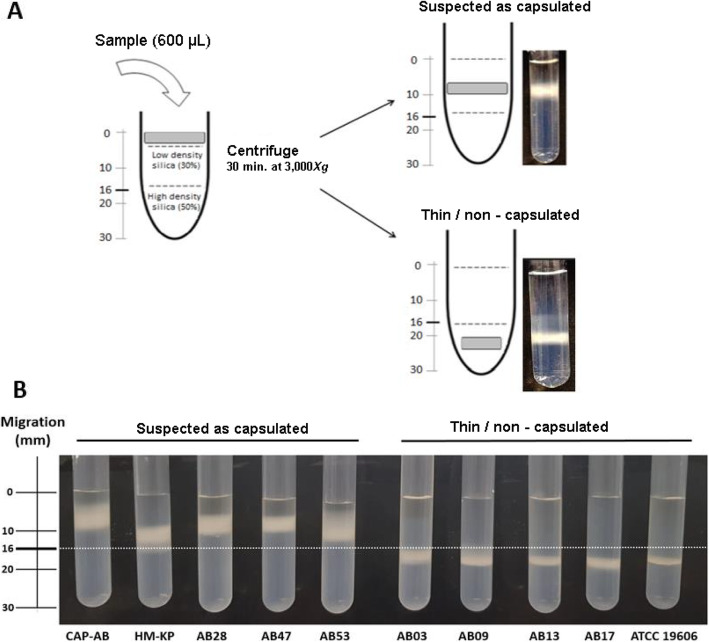
Fig. 3.
a Schematic illustration of the density-dependent gradient test. Bacterial cells (gray square) are applied to the top of a gradient matrix fixed in two phases (30 and 50% silica concentration). Following centrifugation, the bacterial cells migrate to either the top phase of the gradient (0 to 16 mm), indicating that the strain may be capsulated, or to the bottom phase (> 16 mm), indicating a thin or non-capsulated strain. b Density-dependent gradient test results. On the left are the two capsulated control strains (CAP-AB and HM-KP) and three representative isolates suspected to be capsulated, with bacterial bands in the top phase (0–16 mm). On the right is the control strain ATCC 19606 and four representative thin/non capsulated isolates with bands in the bottom phase (> 16 mm)

