
Figure 3.
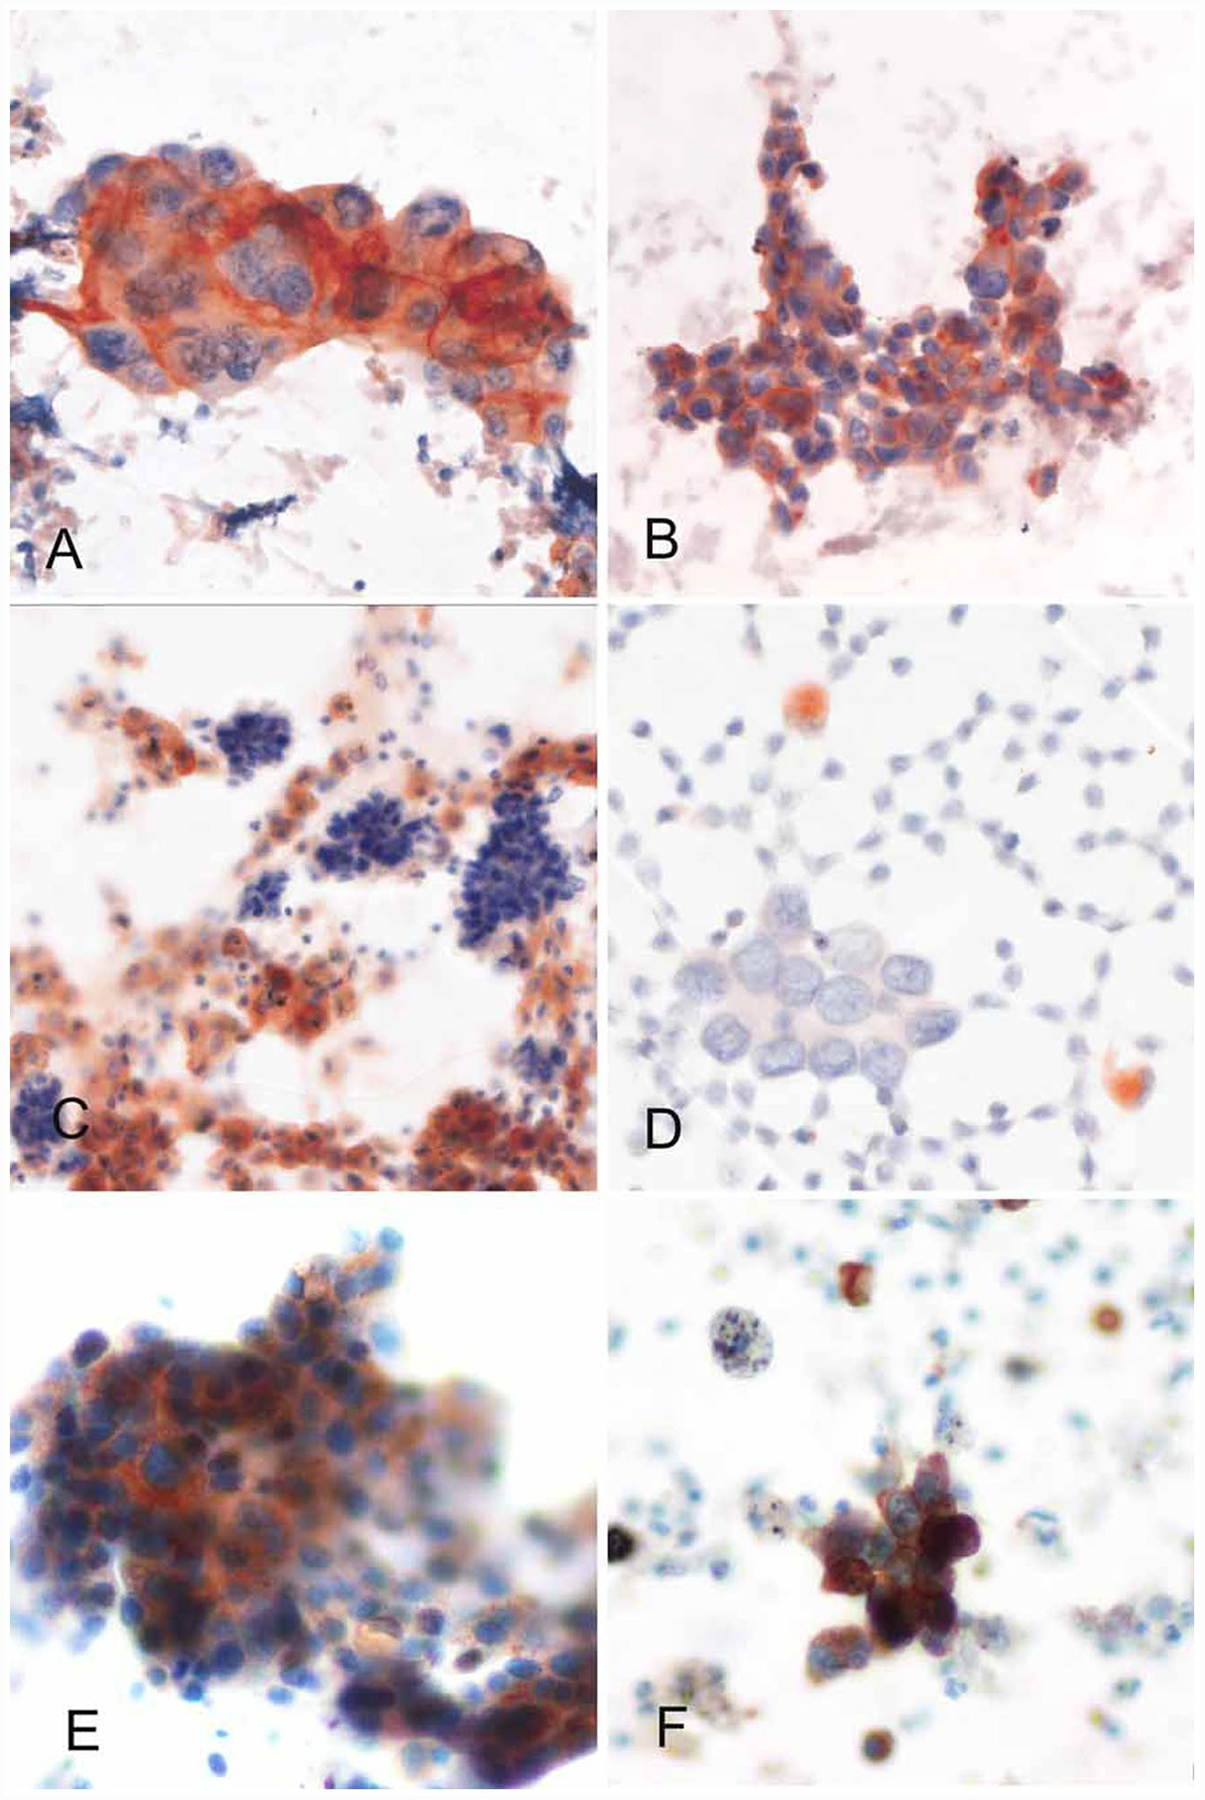
PD-L1 immunocytochemistry images of non-CB cytology specimens. (A, B, E, F) NSCLC with almost all tumor cells positive for PD-L1. Both membranous as well as diffuse staining is evident. (C, D) PD-L1–negative tumor cells with macrophages serving as an internal positive staining control. (A-D) Laboratory-developed test using concentrated SP142 antibody on Leica Bond. (E, F) SP263 IHC assay on Ventana Benchmark XT (E, magnification ×400; F, magnification ×200).