
Figure 4.
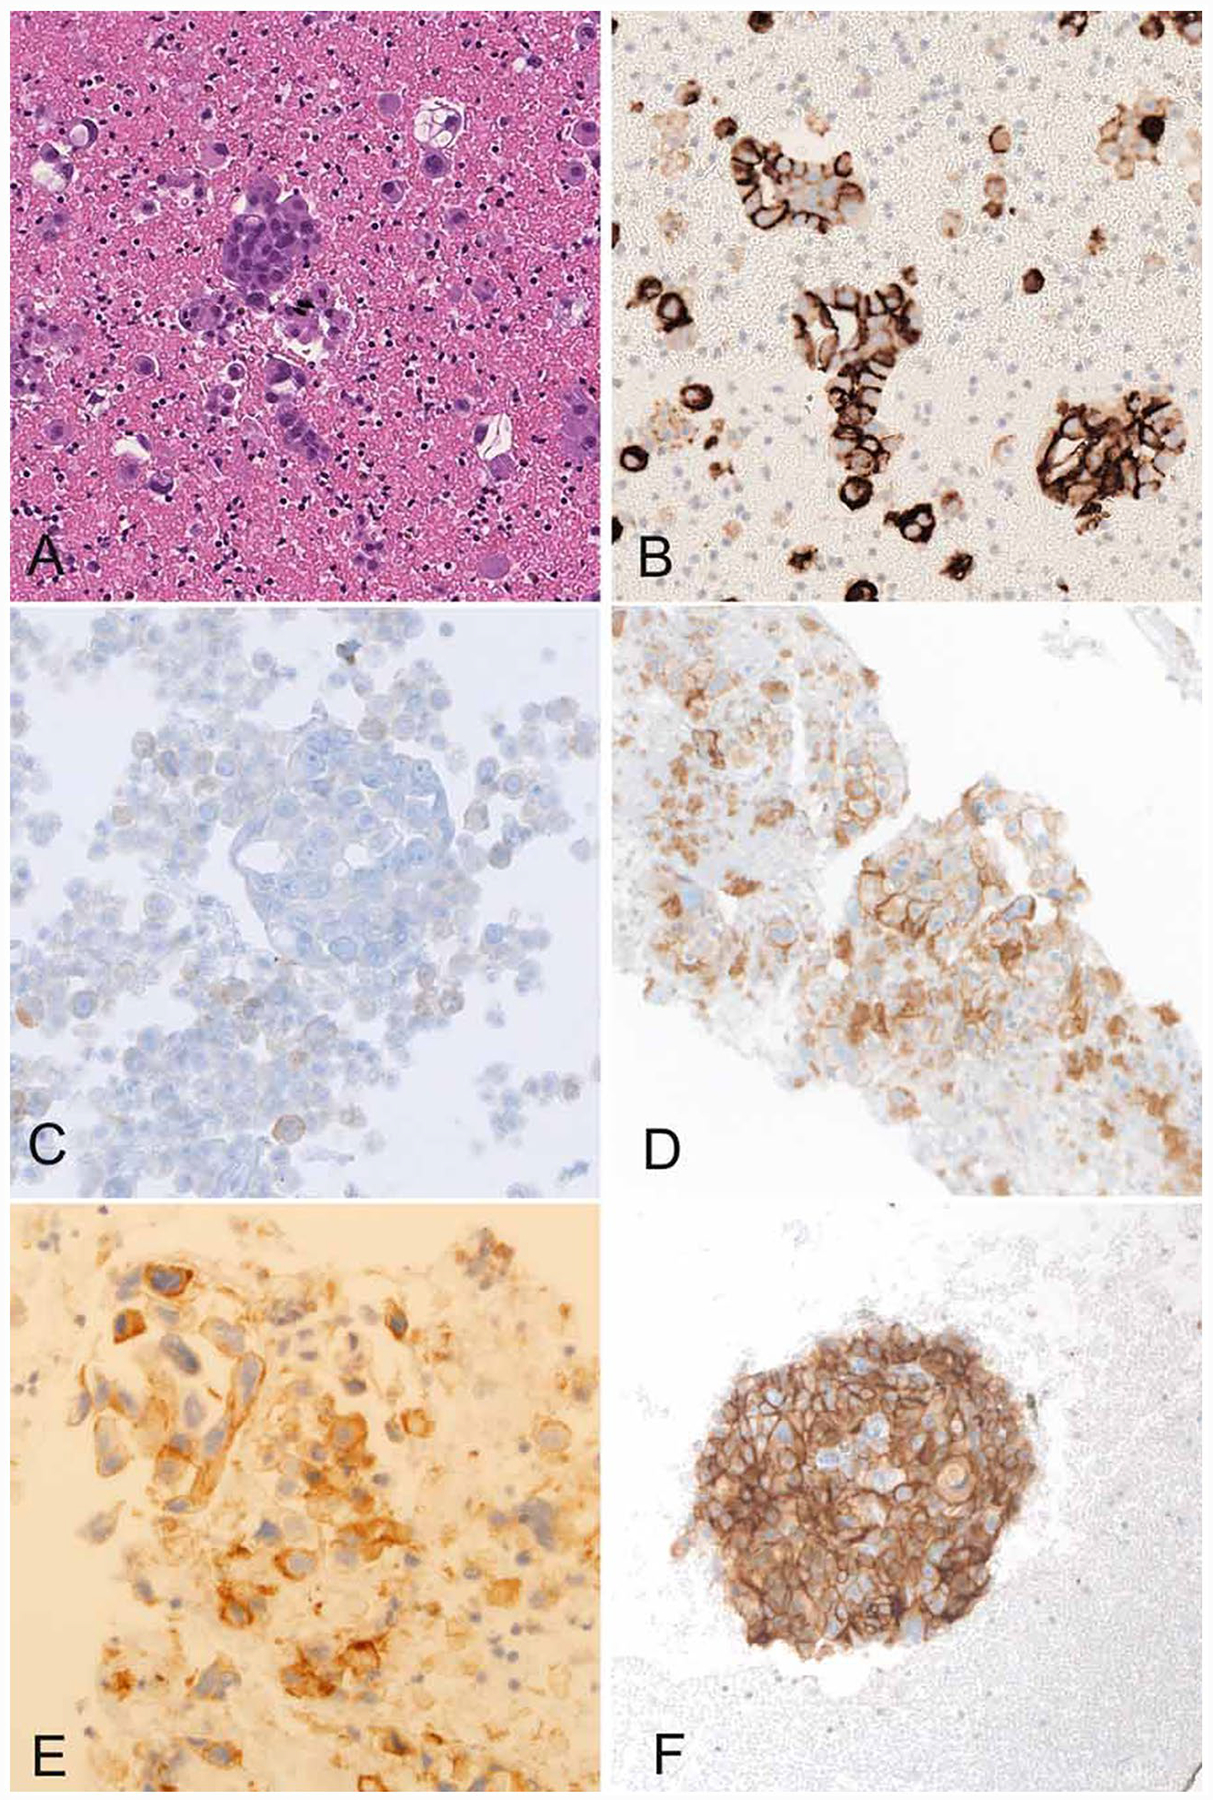
PD-L1 immunocytochemistry images of CB specimens. (A, B) NSCLC with all tumor cells being positive for PD-L1 (hematoxylin and eosin and PD-L1, magnification ×200). (C) PD-L1–negative aggregate of adenocarcinoma cells and adjacent histiocytes, some of which are weakly PD-L1–positive (magnification ×400). (D) NSCLC with most tumor cells being PD-L1–positive (magnification ×200). (B-D) Laboratory-developed tests using DAKO 22C3 on Ventana BenchMark. (E, F) PD-L1–positive NSCLC by Ventana PharmDx Assay on BenchMark (magnification ×400).