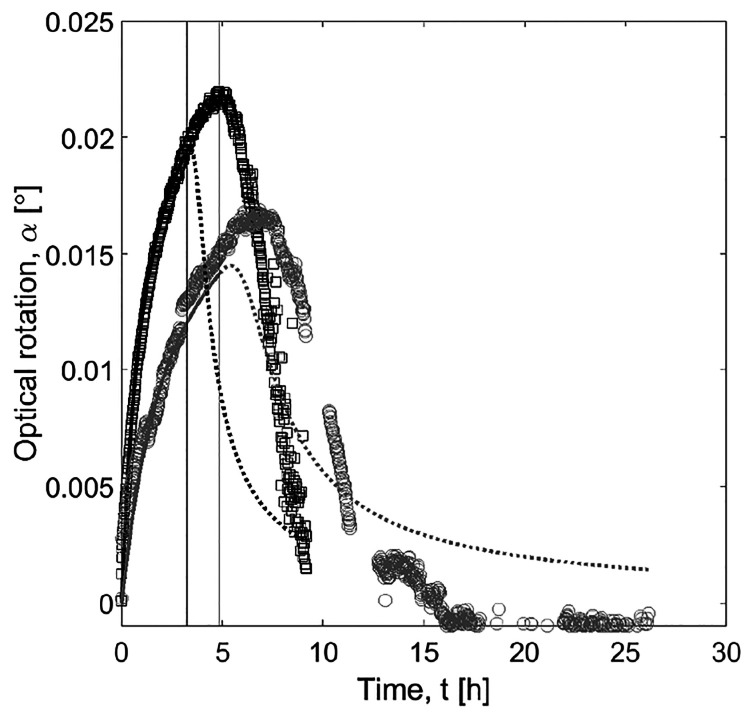
Figure 11.
Case study 2: Impact of crystallization temperature in SCM parameters. Black squares: Experiment I(2), S0 = 1.24, Tcryst = 30 °C. Gray circles: Experiments IV(2), S0 = 1.26, Tcryst = 25 °C. Solid curves: SCM simulations until tstop. Dotted curves: extrapolations of these predictions beyond tstop.

