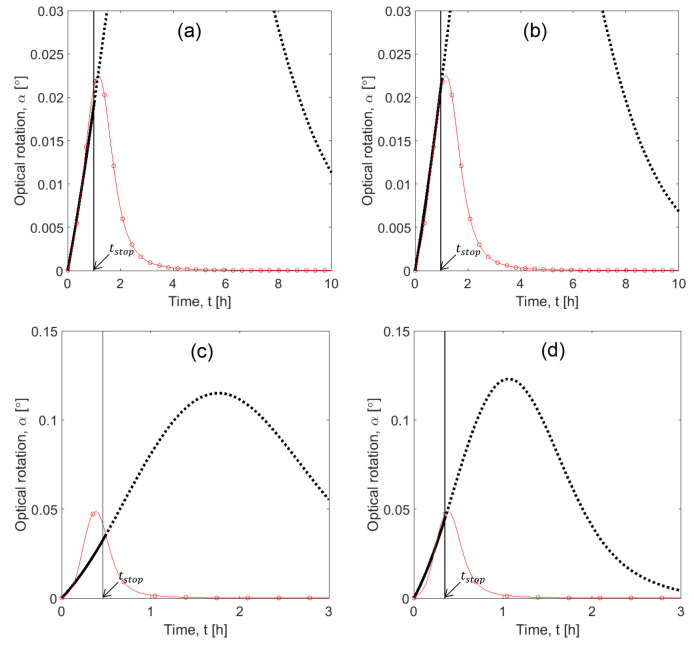
Figure 6.
Case study 1: Range of application of SCM. Comparison of SCM results with additional “experiments”. PC profiles were generated with PBM (red line and circles). Simulations for supersaturations S0 = 1.20 in panels a and b (Table 1, experiment IV(1)) and S0 = 1.37 in panels c and d (Table 1, experiment V(1)). SCM plots, in panels a and c, parameters previously estimated (Table 2) and, in panels b and d, parameters estimated by new fit. Solid black curve: SCM. Dotted curves: Extrapolation of SCM beyond tstop. Tcryst = 18 °C and mseeds = 1.0 g for all PBM experiments.

