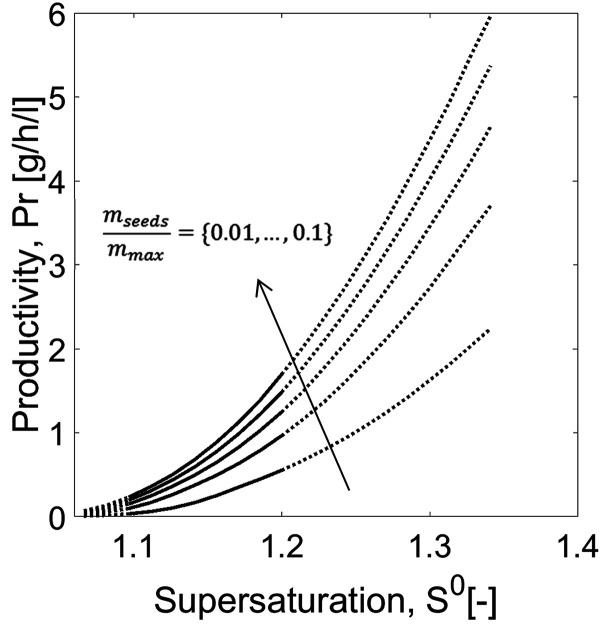
Figure 7.
Case study 1: Productivity estimated using SCM (eq 23) and impact of seed mass. Solid curves: Range of application of SCM within the experimental conditions studied; its lower limits are delimited by the range of S0 studied in the “experiments” and its upper limits are bound by the width of MSZ (dotted curves). Tcryst = 18 °C and mseeds/mmax = 0.010, 0.032, 0.055, 0.077, and 0.100.

