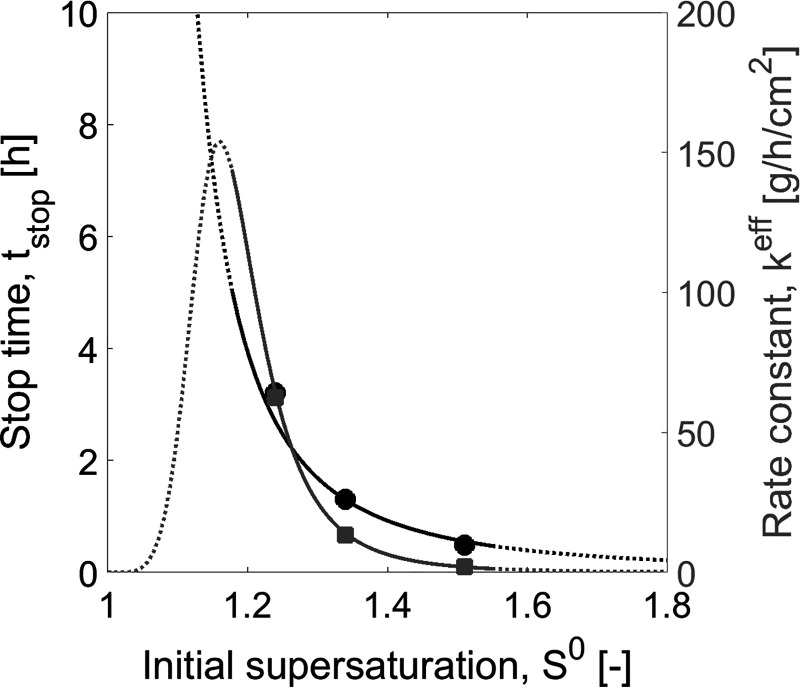
Figure 8.
Case study 2: Correlation of SCM parameters tstop and keff as a function of initial supersaturation S0. Solid symbols: Experimental data (Table 1, experiments I(2)–III(2)). Lines: Correlation functions (eq 26 and 27). Stop time tstop: Black curves and circles. Effective rate constant keff: Gray curves and squares. Solid lines define the range of application of the SCM. Tcryst = 30 °C and mseeds = 0.2 g for all experiments.

