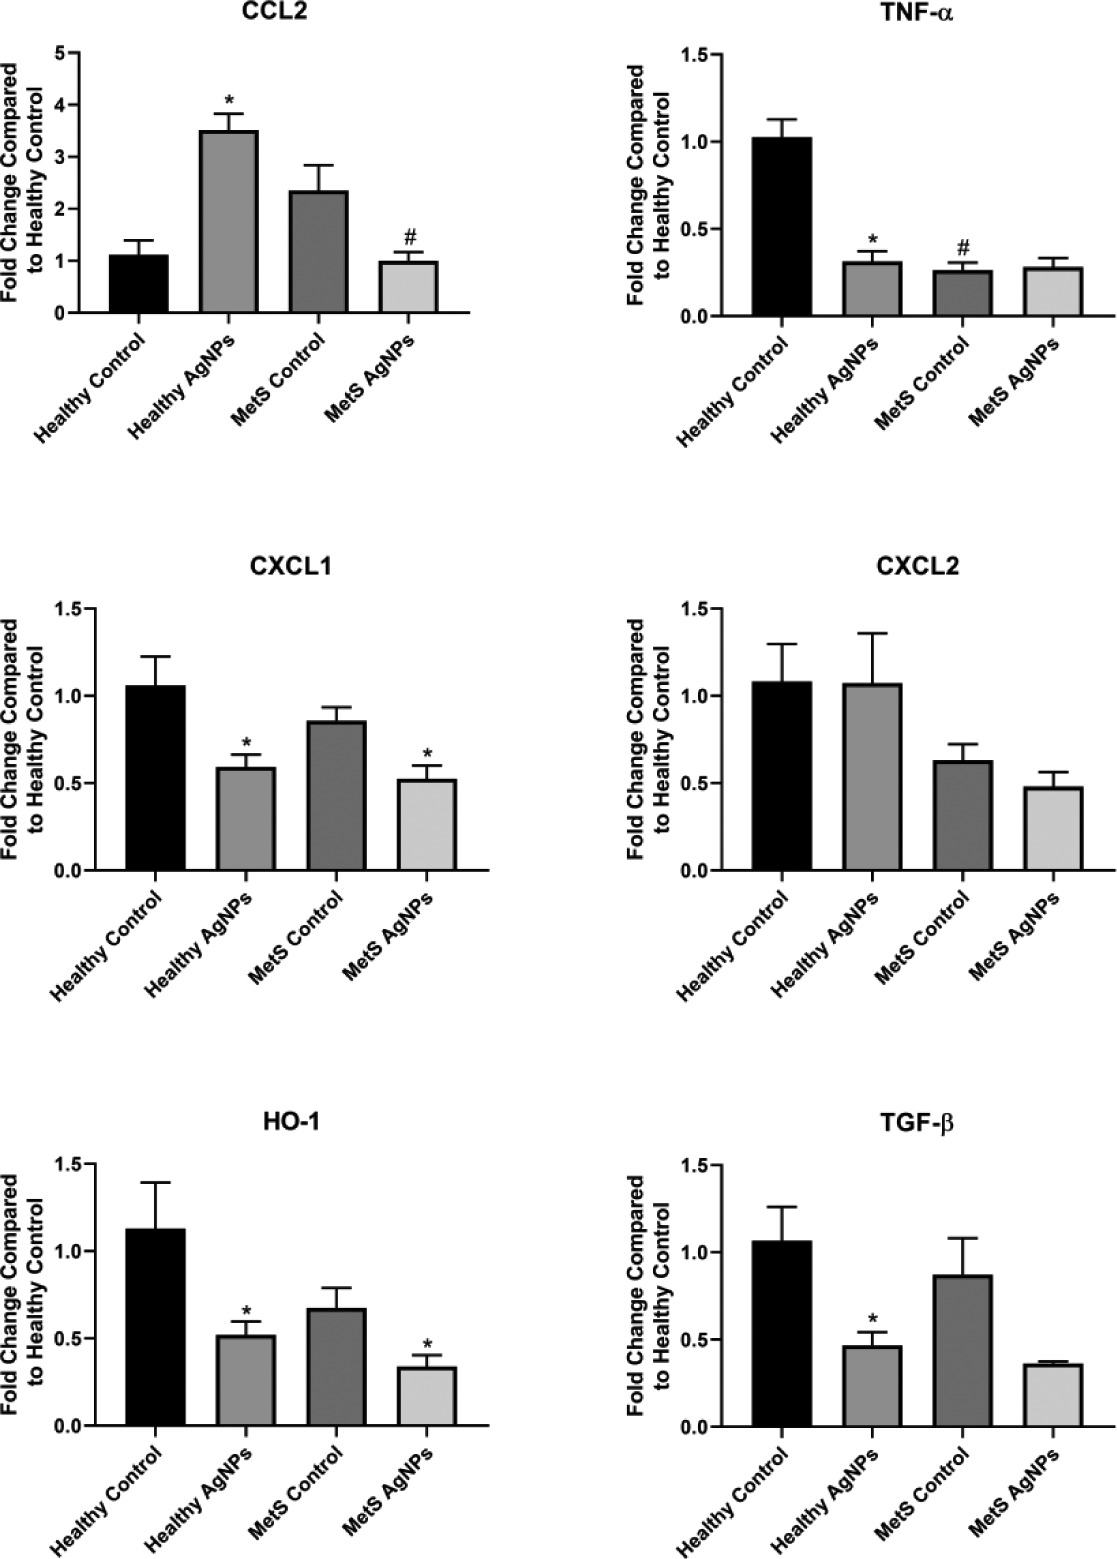
Figure 8.

Changes in Gene Expression in the Brain Following Exposure to AgNPs in Healthy or MetS Mice. Gene expression of TNF-α, CCL2, CXCL1, CXCL2, HO-1, and TGF- β and GAPDH (control) was assessed through PCR to evaluate the inflammatory, pro-fibrotic, and oxidative stress responses induced by AgNP exposure. All analyses are reported as mean ± SEM (n=6–8/group). * denotes statistical significance as compared to the corresponding untreated control group, and # denotes statistical significance as compared to the corresponding healthy group. Comparisons were performed by two-way ANOVA with Tukey post hoc analysis; p<0.05).
