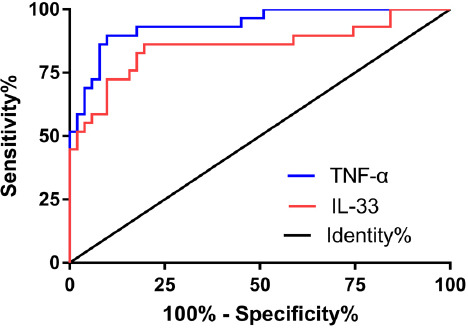
Figure 3.

ROC curve for predicting the efficacy of TNF-α and IL-33 in AS patients. The red line was the ROC curve of IL-33 in efficacy prediction of AS, and the AUC was 0.853, 95CI%: 0.754-0.952, sensitivity: 93.33%, specificity: 88.00%, and Youden index: 81.33%. The blue line was the ROC curve of TNF-α in efficacy prediction of AS, the AUC was 0.939, 95CI%: 0.886-0.992, the sensitivity was 93.33%, the specificity was 88.00%, and the Youden index was 81.33%.
