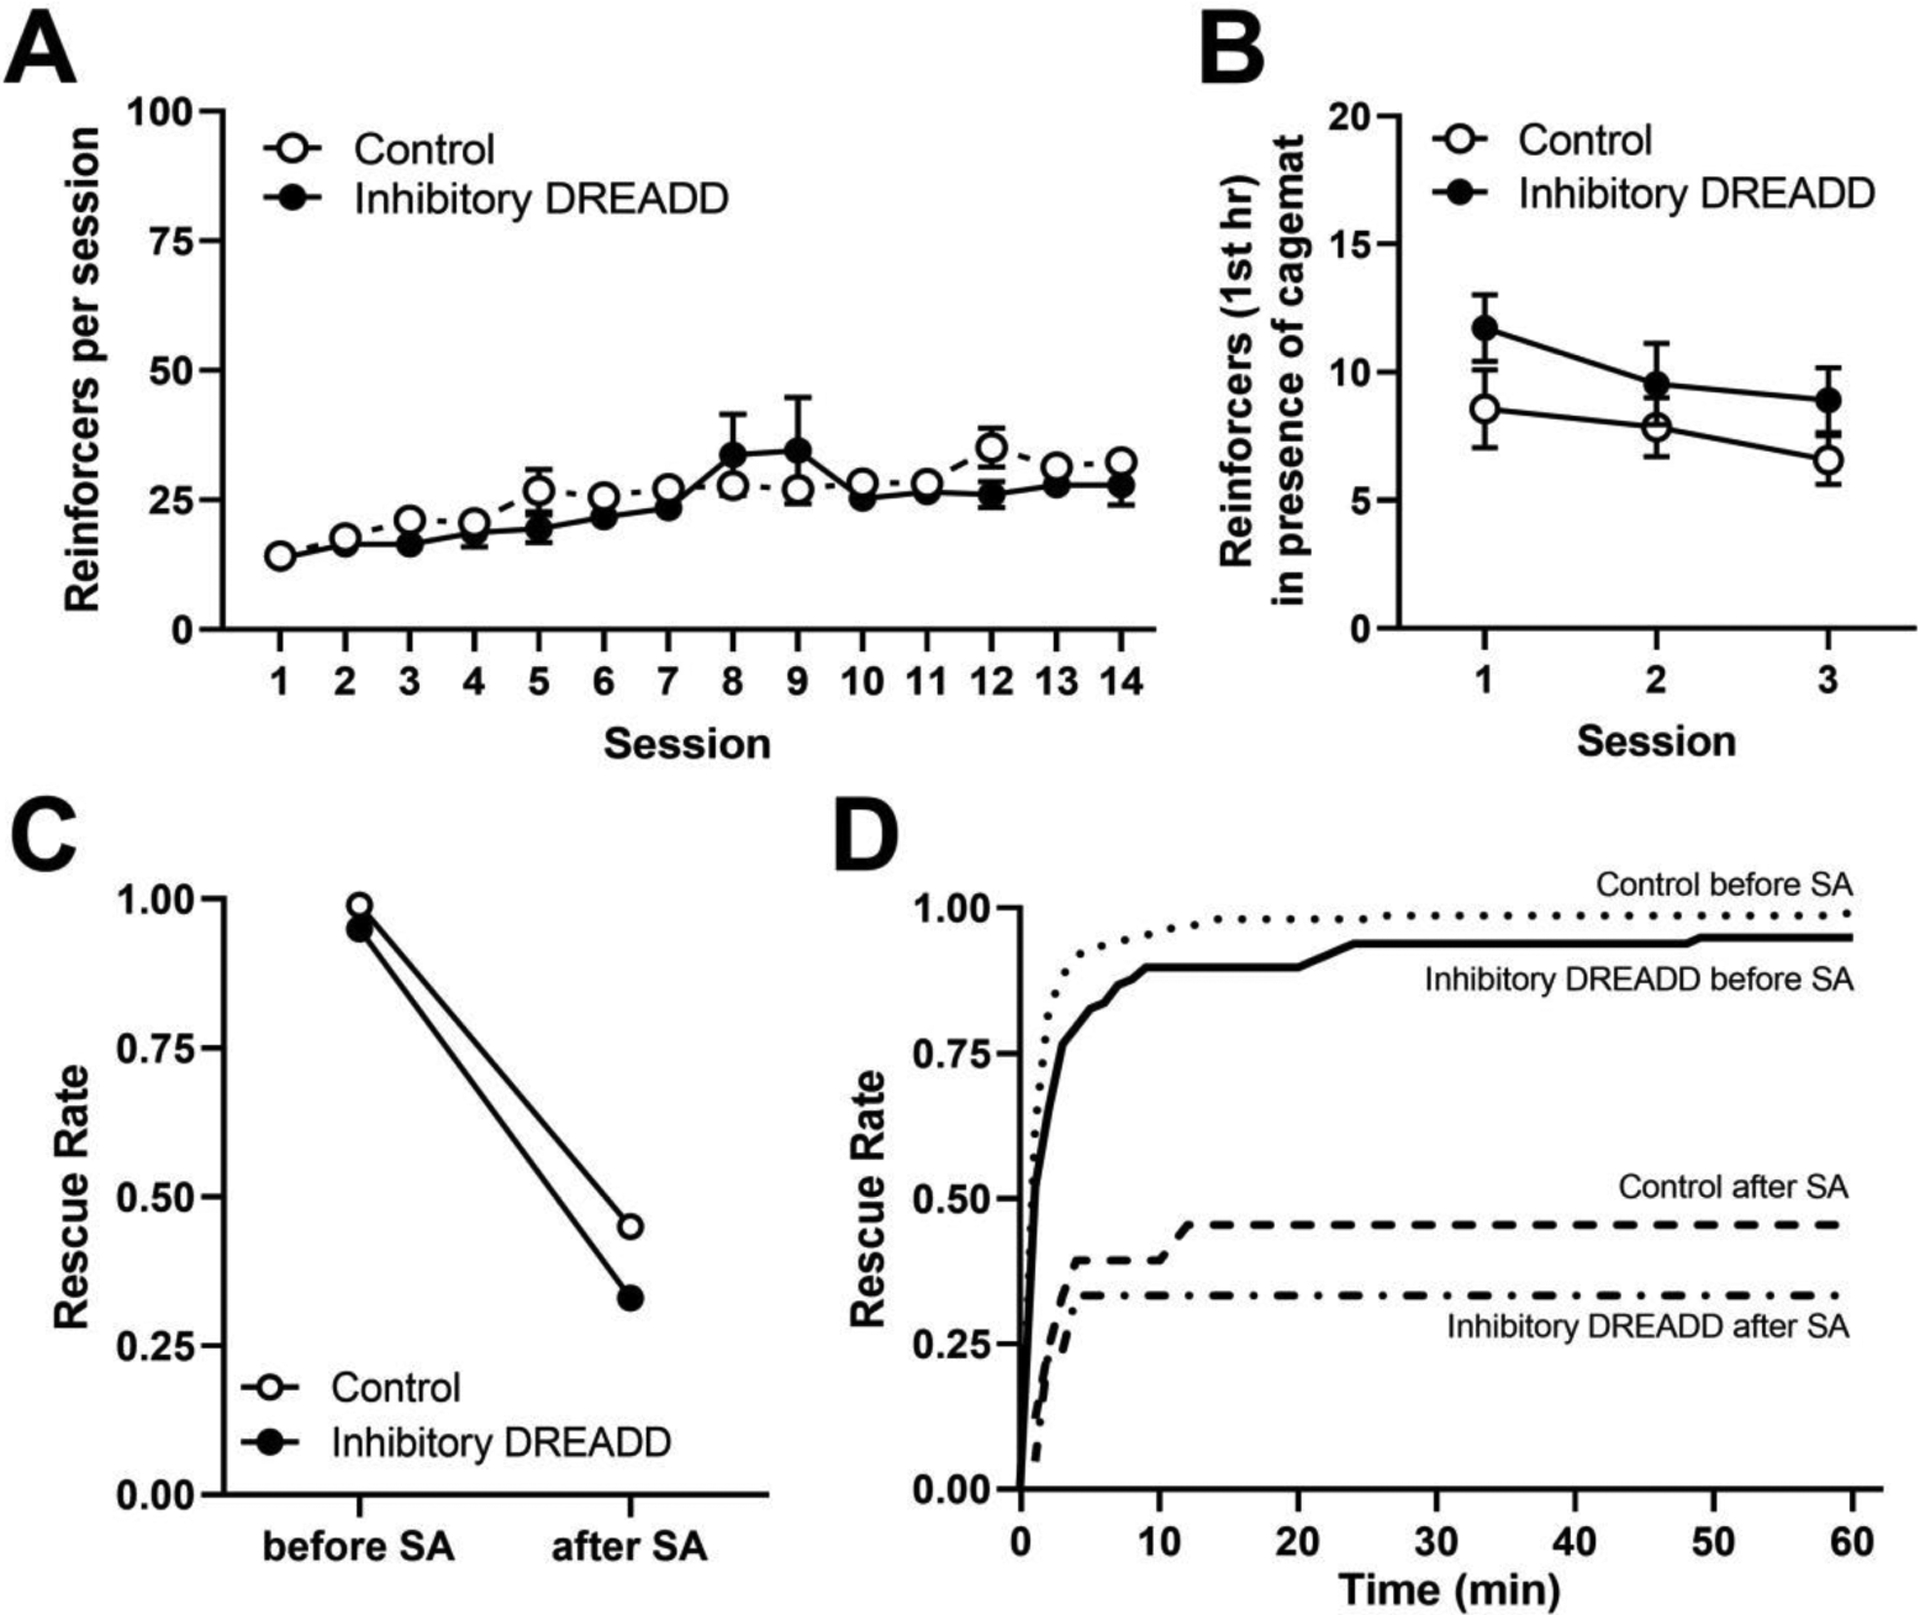
Figure 5.

A) Average heroin intake per session during the initial acquisition of heroin self-administration (n=7 for inhibitory DREADD, n=11 for control virus). B) Average heroin intake in the first hour during the 3 test sessions where rats were given simultaneous access to receiving heroin and rescuing its cage-mate. C) Average rescue rates before and after the self-administration phase of the experiment for each treatment condition. D) Rescue behavior across the 60 min session in each virus conditions before and after the self-administration phase of the experiment. Survival lines represent the average proportion of completed rescues per rat within each group at each time point throughout the 60-minute period, averaged across the 3 sessions.
