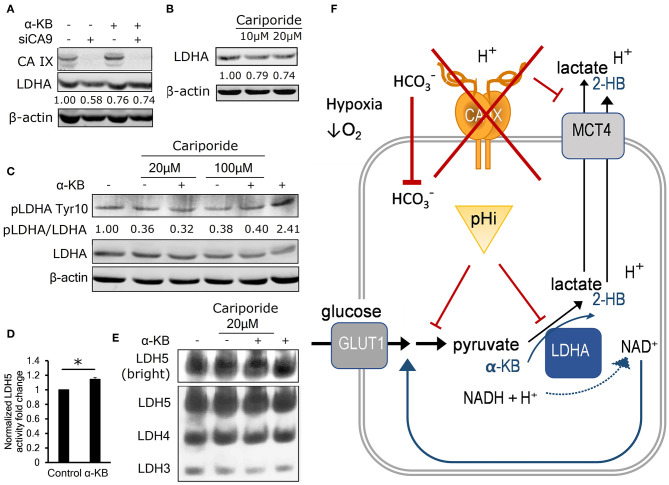
Figure 4.
Intracellular acidosis decreases LDHA level and activity. (A) Representative immunoblot (n = 3) showing LDHA levels in control and α-KB-treated A-549 KD cells incubated for 48 h in 1% O2, numbers represent relative LDHA levels quantified against β-actin in the presented blot. (B) Representative immunoblot (n = 3) showing the effect of sodium-hydrogen antiporter 1 (NHE-1) inhibition by cariporide on LDHA levels in normoxic parental HT-1080 cells, numbers represent relative LDHA levels quantified against β-actin in the presented blot. (C) Representative immunoblot (n = 3) showing the effect of 48h cariporide and α-KB treatment on the levels of activating LDHA tyrosine 10 phosphorylation (pLDHA Tyr10) in normoxic HT-1080 cells, numbers represent pTyr10/LDHA ratio in the presented blot. (D) LDH5 activity of normoxic HT-1080 cells in response to α-KB (n = 3). (E) Representative LDH activity assay showing LDH5 in the enhanced contrast field (bright, top) and resolved LDH5-LDH3 isoforms (bottom) in response to α-KB and 20 μM cariporide. (F) Schematic indicating the interaction between CAIX, pHi, and the regulation of glycolysis and lactate production. Error bars are ±SEM. P-values were calculated against Control by t-test. *P < 0.05; **P < 0.01 ***P < 0.001.

