Figure 1.
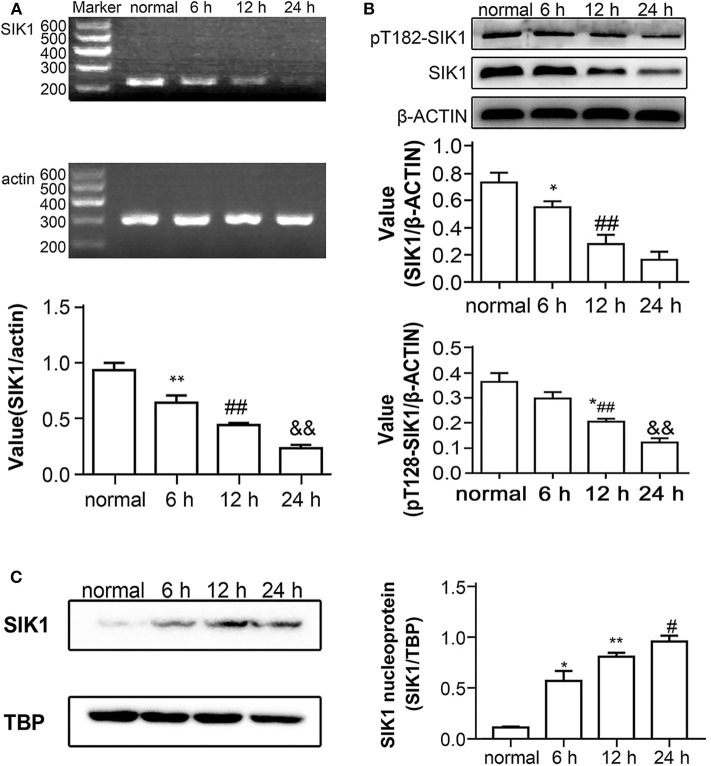
Effects of high glucose on SIK1 expression and nucleus/cytoplasmic location in HepG2 cells. (A–C) HepG2 cells were cultured in regular DMEM supplemented with a normal concentration of glucose (5.5 mmol/l D-glucose) or in DMEM supplemented with a high concentration of glucose (25 mmol/l D-glucose) for 6, 1,2, and 24 h. The expression levels of SIK1 mRNA were determined by semi-quantitative PCR with actin as the internal control gene (A). The levels of total SIK1 protein and phosphorylated SIK1 protein at the T182 site were determined by immunoblotting (B). The nuclear expression of SIK1 protein in the indicated HepG2 cells was determined by immunoblotting with TBP as the internal control protein for cell nuclear extracts (C). Immunoblotting experiments were repeated at least three times, and one representative immunoblotting is shown for each experiment. n = 3 for bar graphs in (A–C). *P < 0.05, **P < 0.01, compared with the normal glucose group; #P < 0.05, ##P < 0.01, compared with the 6 h group; &P < 0.05, &&P < 0.01, compared with the 12 h group.

