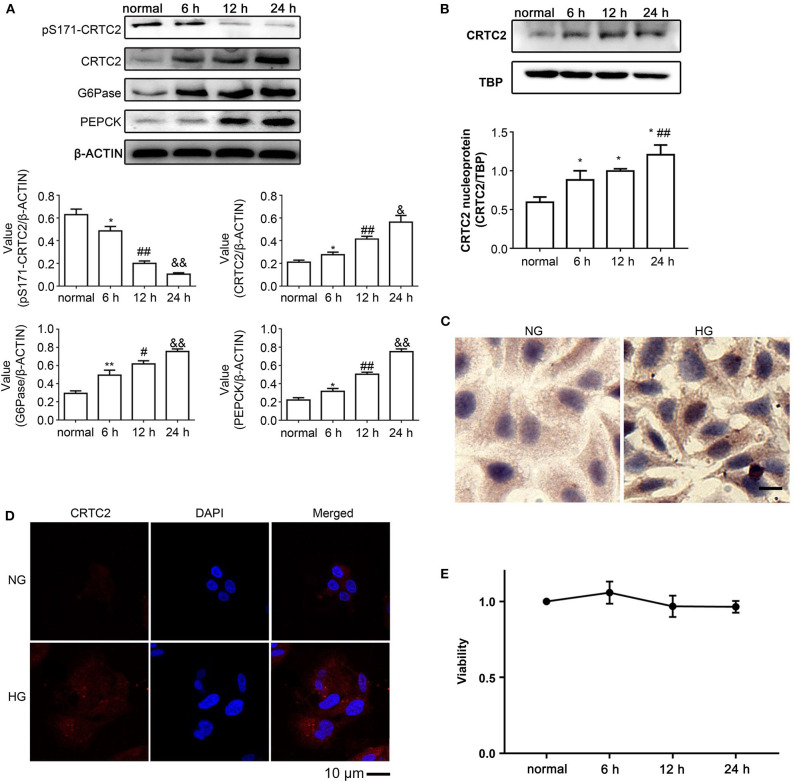
Figure 2.
Effects of high glucose on the CRTC2 signaling pathway in HepG2 cells. (A) The protein levels of the CRTC2 signaling-associated molecules, including total CRTC2, phosphorylated CRTC2 at S171, G6Pase, and PEPCK were determined by immunoblotting assays. (B) The levels of nuclear CRTC2 in control HepG2 cells and HepG2 cells that underwent the indicated treatments were determined by immunoblotting with TBP as the internal control protein for cell nuclear extracts. (C) Representative images show the immunohistochemistry of PEPCK in HepG2 cells cultured under normal glucose and high glucose conditions for 24 h. (D) The distribution of CRTC2 in HepG2 cells after incubation in normal or high glucose medium for 24 h was evaluated by immunofluorescence. Scale bar, 10 μm. (E) The viability of HepG2 cells that underwent the indicated treatments were evaluated using the MTT method. Immunoblotting experiments were repeated at least three times, and one representative immunoblotting is shown for each experiment. n = 3 for graphs in (A,B,E). *P < 0.05, **P < 0.01, compared with the normal glucose group; #P < 0.05, ##P < 0.01, compared with the 6 h group; &P < 0.05, &&P < 0.01, compared with the 12 h group.

