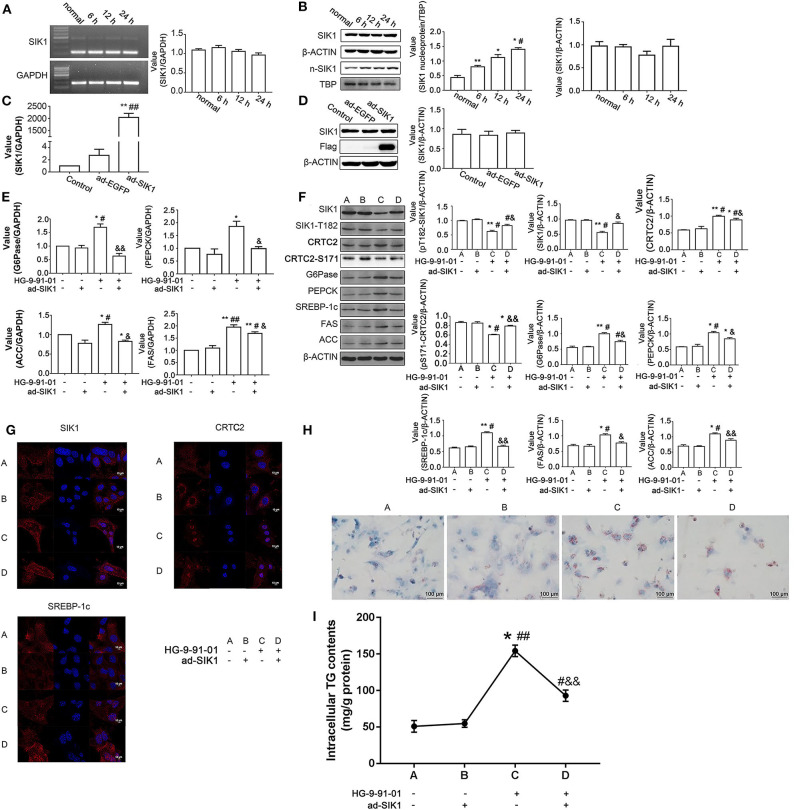
Figure 4.
SIK1 regulates the CRTC2 signaling pathway and lipid metabolism in mouse primary hepatocytes. (A,B) Primary hepatocytes were isolated from wild type C57BL/6 mice and cultured in regular DMEM supplemented with a normal concentration of glucose (5.5 mmol/l D-glucose) or in DMEM supplemented with a high concentration of glucose (25 mmol/l D-glucose) for 6, 12, and 24 h. The mRNA levels of SIK1 (A) and the protein levels of total SIK1 in whole cells or nuclear extracts (B) were determined with PCR and immunoblotting, respectively. (C,D) Mouse primary hepatocytes were left untreated (Control), or infected with control adenovirus (ad-EGFP), or infected with Flag-tagged SIK1-expressing adenovirus (ad-SIK1), and cultured in regular medium for 48 h. The mRNA level of SIK1 (C) and the protein levels of SIK1/flag (D) were determined by qPCR and immunoblotting, respectively. (E–H) Mouse primary hepatocytes were left untreated, or treated with ad-SIK1 infection alone, or treated with 5 μM HG-9-91-01 incubation alone, or treated with simultaneous ad-SIK1 infection and 5 μM HG-9-91-01 incubation, and cultured in regular medium for 48 h. The mRNA (E) and protein (F) levels of the indicated molecules in mouse hepatocytes were determined by qPCR and immunoblotting, respectively. The cellular distributions of SIK1, CRTC2, and SREBP-1c in the indicated groups were evaluated by immunofluorescence (G). Representative images showed the Oil Red O staining results of primary mouse liver cells after the indicated treatments (H). (I) Quantitation of (H). Scale bar, 10 μm in (G), 100 μm in (H). n = 3 for graphs in (A–F). *P < 0.05, **P < 0.01, compared with the Control group; #P < 0.05, ##P < 0.01, compared with the 6 h/ad-SIK1 group; &P < 0.05, &&P < 0.01, compared with the HG-9-91-01 alone group.

