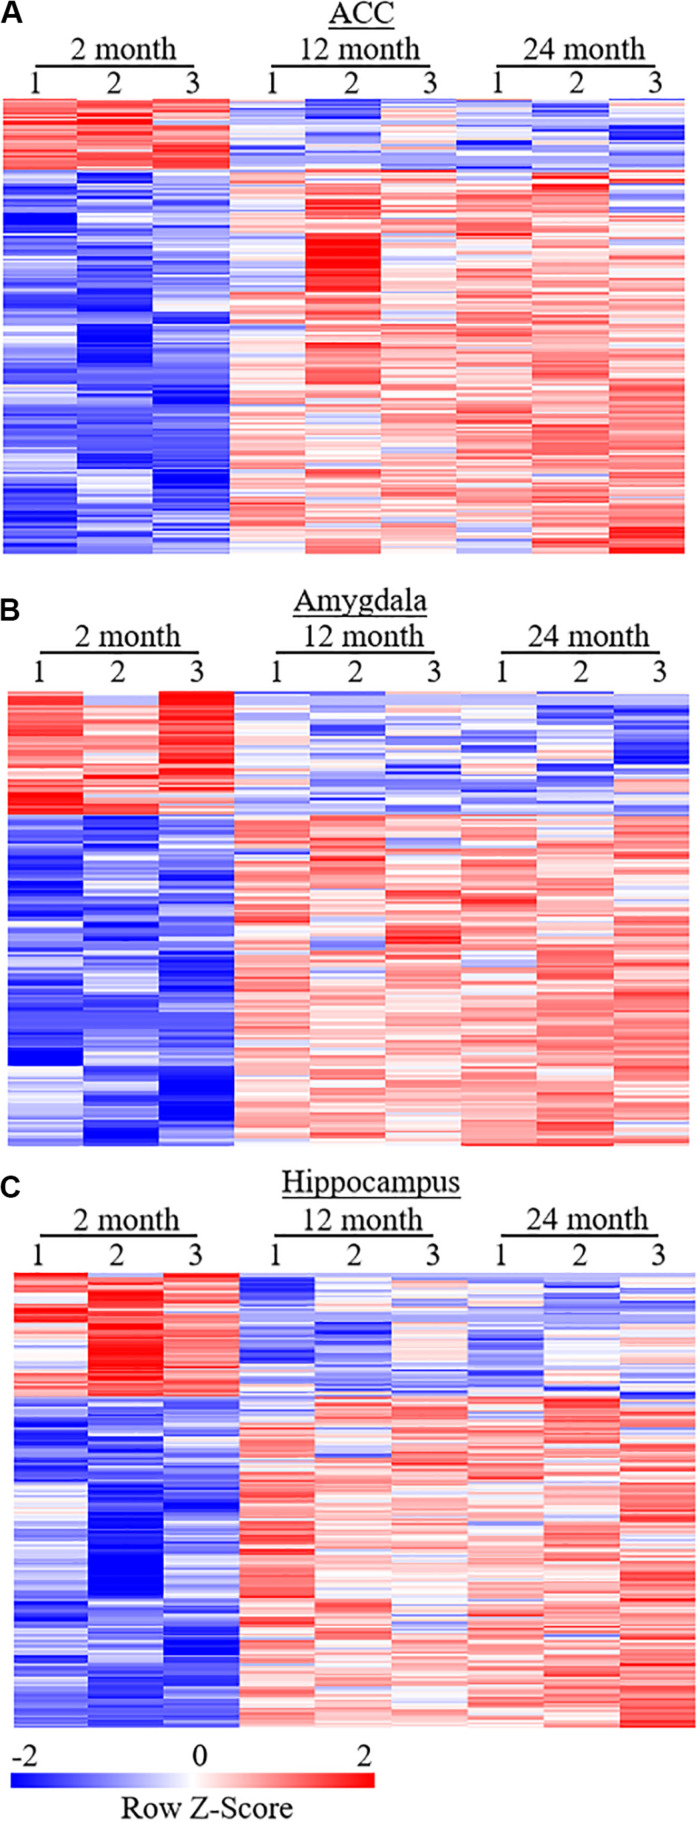
FIGURE 5.
Heatmaps of differentially expressed genes (DEGs) in the ACC (A), amygdala (B), and hippocampus (C) from both 12- and 24-month old mice versus 2-month old mice. Colors in the heatmaps indicate the Row Z-score among the different data sets. High expression is shown by the red color spectrum, and low expression is shown by the blue. N = 3 biological repeats (3 mice)/age.

