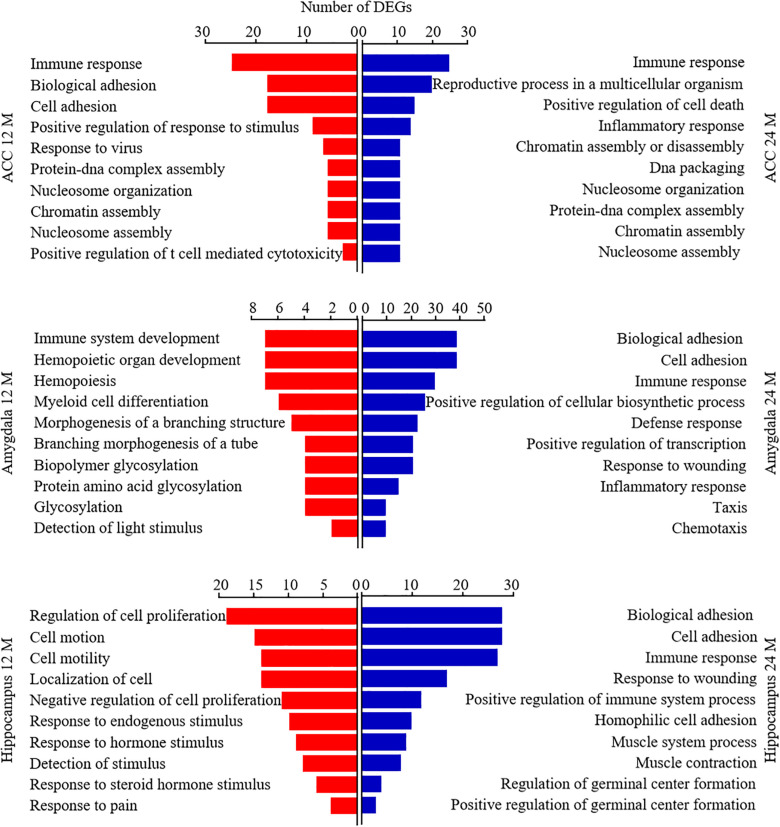
FIGURE 7.
Functional enrichment analysis of the differentially expressed genes (DEGs) in aging mice. Analysis of the Gene Ontology database showed top 10 biological processes of the DEGs in the ACC (top), amygdala (middle), and hippocampus (bottom) from 12- and 24-month old mice according to the P-value of biological process. The DAVID database was used to do the GO enrichment analysis. Red and blue color bars represent 12- and 24-month old mice, respectively.

