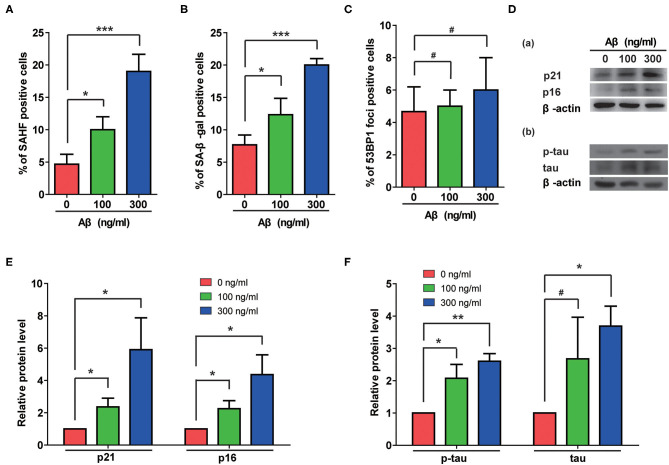
Figure 3.
Aβ treatment induced senescent phenotypes and upregulation of total and phosphorylated tau protein in rat astrocytes. (A–C) Statistical analysis of SAHF- (A), SA-β-gal- (B), and 53BP1-foci- (C) positive cells in rat astrocytes treated with different concentrations of Aβ for 2 days. (D) Protein levels of p21 and p16 (a), p-tau and tau (b) in rat astrocytes following treatment with different concentrations of Aβ. (E,F) Quantification of (D). Data indicate the mean values calculated from three independent experiments (±SD).

