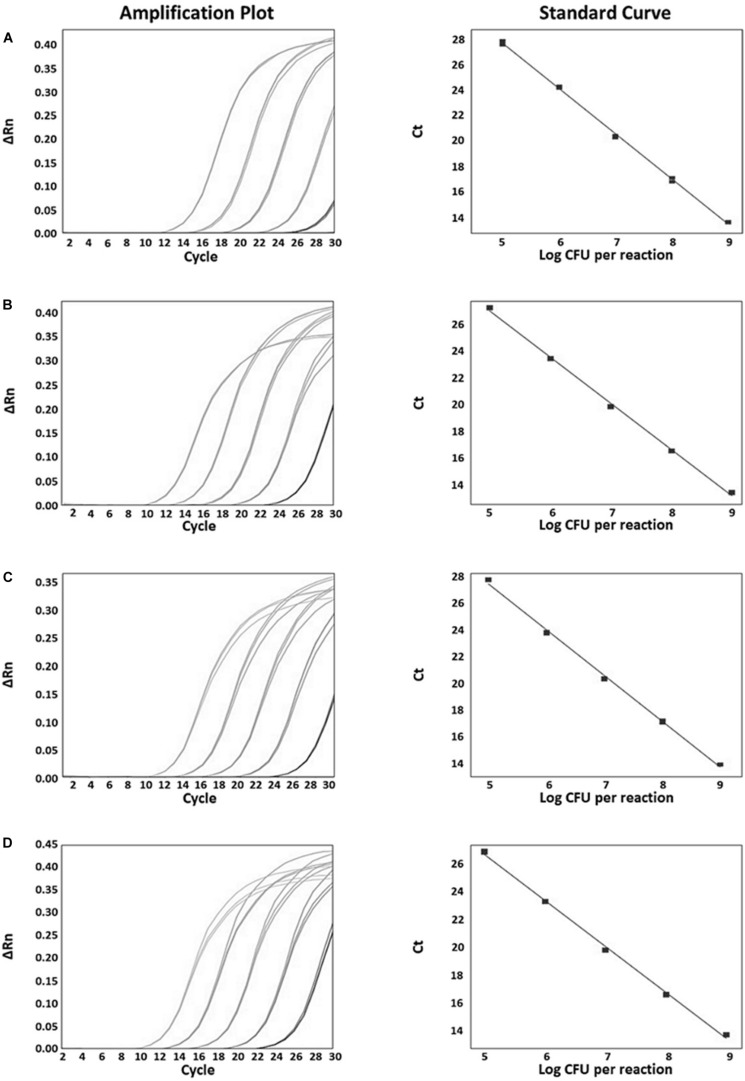
FIGURE 4.
Real-time PCR amplification plots and standard curves which were mainly used in probiotic products for quantitative evaluation. (A) B. animalis subsp. lactis amplification plot (left), standard curve between 20 and 0.002 ng (y = –3.564x + 18.03, R2 = 0.998, Eff% = 90.788, right); (B) B. bifidum amplification plot (left), standard curve (y = –3.438x + 17.713, R2 = 0.998, Eff% = 95.359, right); (C) B. breve amplification plot (left), standard curve (y = –3.448x + 18.169, R2 = 0.998, Eff% = 94.987, right); (D) B. longum subsp. infantis amplification plot (left), standard curve (y = –3.312x + 17.727, R2 = 0.998, Eff% = 100.424, right).

