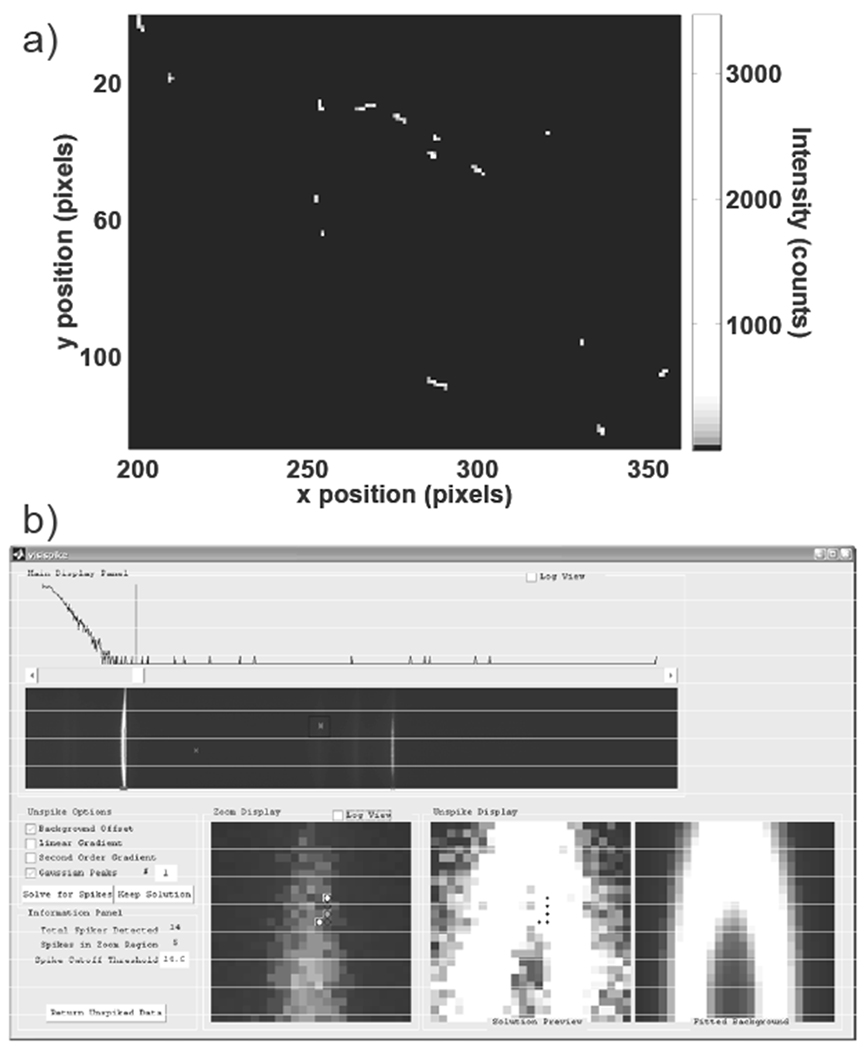
Figure 1.

Example of cosmic ray spikes and VisiSpike correction program interface. In a), a portion of the cosmic ray signals accumulated over one hundred 10 second dark exposures are shown. Cosmic ray signals vary substantially in position, morphology, and intensity. In b), the VisiSpike program is shown. In the upper portion of the window the spectral image and a histogram with accompanying slider for highlighting signals exceeding the threshold are shown. At the bottom a zoomed view of the region of interest with potential spike pixels marked for replacement in the bottom left, the estimated background signal at bottom right, and the zoom region with the spike pixels interpolated in the bottom middle. On the left are options for various 2D background fitting functions. The user has the option to correct for spikes using a combination of 2D constant offset, linear, exponential, and Gaussian functions.
