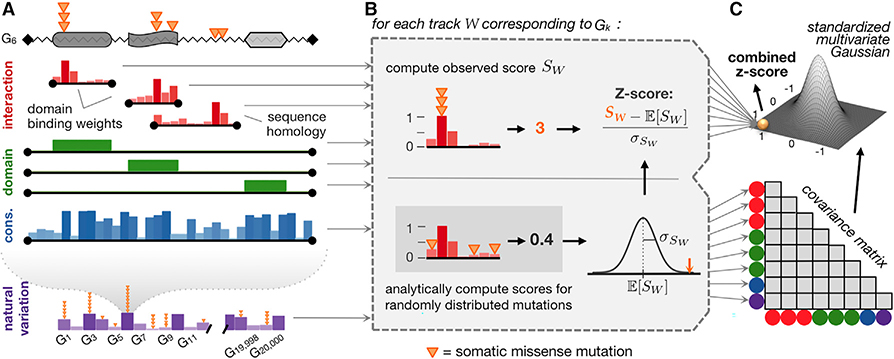
Figure 1. PertInInt Uncovers Cancer Driver Genes by Integrating Per-Site Interaction, Domain, and Conservation Information with Whole-Gene Mutation Frequency Data.
(A) Somatic mutations (orange triangles) found across sequenced tumors that affect a protein sequence (jagged line) with three domains (gray regions) are evaluated with respect to different measures of functionality, each represented as a “track.” In interaction tracks (red), positions that are more likely to participate in ligand interactions have higher weights (vertical bars). Interaction tracks arise from domain-based binding potential calculations (Kobren and Singh, 2019) (top two red tracks, each covering the length of the respective domain) or homology modeling (Ghersi and Singh, 2014) (bottom red track, covering the length of the modeled region). Domain tracks (green) specify which residues within a protein are part of a specific domain by 0/1 positional weights; here we have a track for each domain within the sequence. The conservation track (blue) weights each position by its evolutionary conservation across species. The natural variation track (purple) models how much each gene varies across healthy populations; here the height of the vertical bars indicates the background mutation probability rather than a per-gene weight, which is 1 for the gene being considered and 0 otherwise. Figure S1 gives further intuition about how these track weights are determined.
(B) For each track W, we compute the score SW of the observed somatic mutations as the sum of the track weights for the positions where they appear (top). To determine whether this score is higher than expected, we consider a model where somatic mutations are shuffled across the positions of the track, and the expected score and the standard deviation of the scores are computed and used to estimate per-track Z scores (bottom); note that in our framework these values are computed analytically instead of relying on the shuffles.
(C) Z scores for all tracks are combined after analytically determining a background covariance model.

