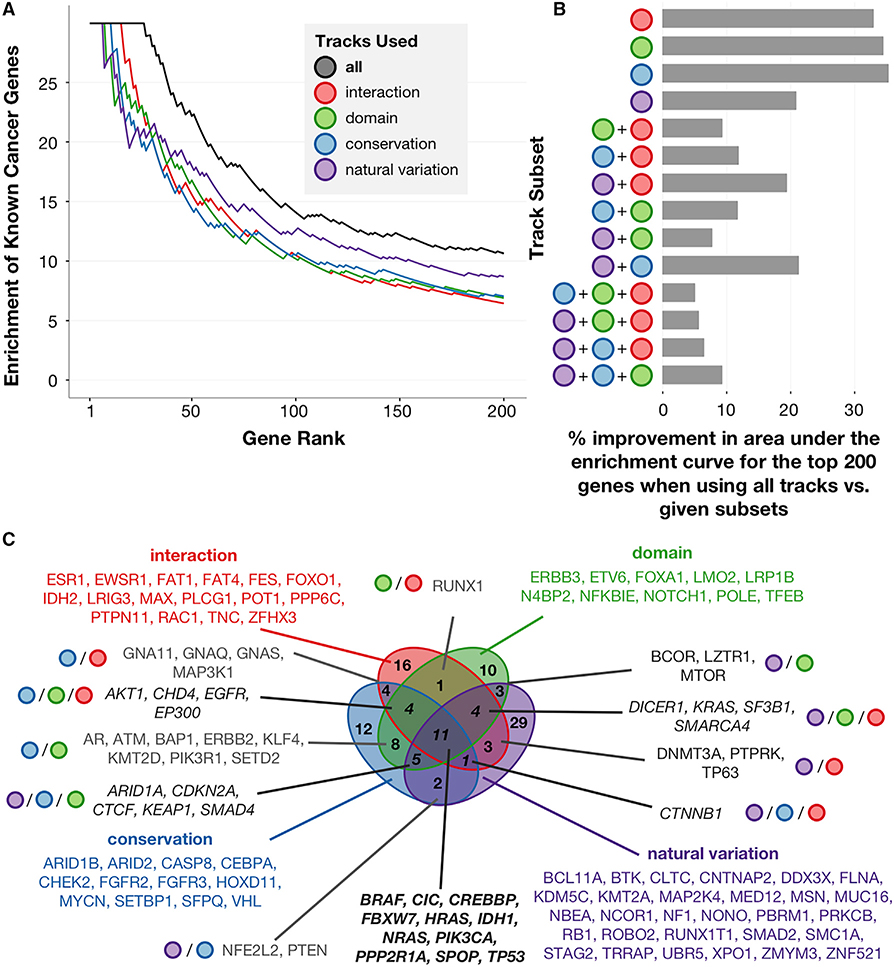
Figure 2. PertInInt Is Highly Effective in Uncovering Cancer Driver Genes Due to Combining Multiple Sources of Information.
(A) Enrichment of CGC genes (y axis) within a given number of top-scoring genes (x axis) when run on the pan-cancer dataset using all tracks together (black), only interaction tracks (red), only domain tracks (green), only the conservation track (blue), and only the natural variation track (purple). Enrichment is computed as the ratio between the fraction of CGC genes in the set of top scoring genes considered (i.e., the precision) and the fraction of CGC genes in the whole set of genes (~0.0334). While uncovering genes enriched for somatic mutations within only interaction sites, only domain positions, only conserved sites, or only over their lengths each yields cancer-relevant genes, performance is highest when PertInInt uses all sources of information together.
(B) Percent improvement in the area under the enrichment curve for the top 200 genes when using all track types versus specific subsets of tracks. PertInInt is more effective in uncovering CGC genes when using all sources of information together than when using any other of the possible subsets of information.
(C) Venn diagram showing the overlap of CGC genes detected in the top 200 genes ranked when considering only interaction, only domain, only conservation, or only natural variation tracks. The different sources of information yield distinct yet overlapping sets of cancer genes.

