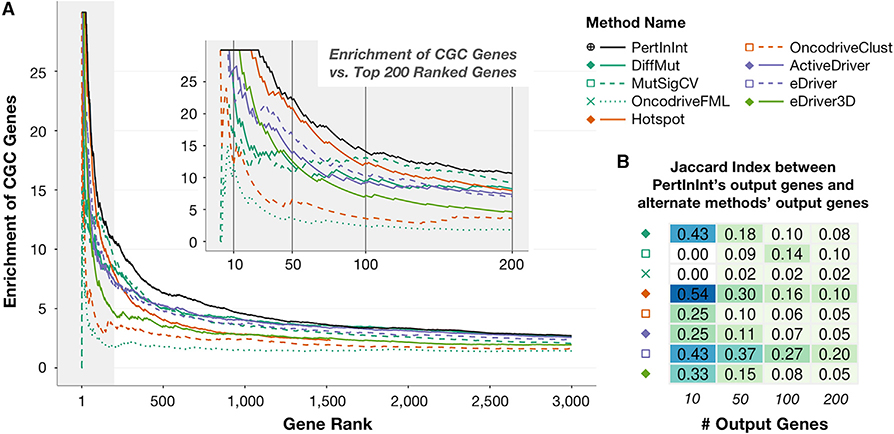
Figure 4. Detection of Known Cancer Genes from a Pan-Cancer Dataset by PertInInt and Alternate Methods.
Each driver gene detection method was run on the pan-cancer set of missense mutations.
(A) Curves indicate the enrichment of CGC genes (y axis) as we consider an increasing number of output genes (x axis) for each driver gene detection method. Enrichment is computed as the ratio between the fraction of CGC genes in the set of top-scoring genes considered (i.e., the precision) and the fraction of CGC genes in the whole set of mutated genes (~0.0334). All methods scored at least 3,000 genes except for Hotspot (orange solid line), which only returned 1,530 genes and whose curve ends at that point. The gray shaded area highlights the plot to 200 genes, a closeup of which is shown in the inset. Vertical lines at 10, 50, 100, and 200 ranked genes in the inset correspond to gene set sizes featured in part (B).
(B) JIs are calculated between the top 10, 50, 100, and 200 genes output by PertInInt and the corresponding top 10, 50, 100, and 200 genes output by each other method. Lighter colors indicate lower JIs and less overlap between the gene sets.

