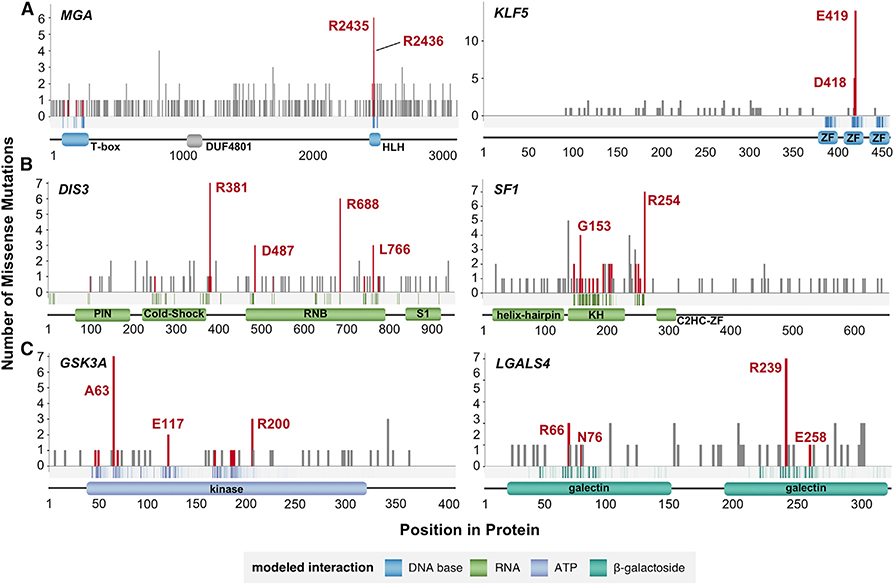
Figure 6. Examples of Genes Ranked Highly by PertInInt that Are Not Known to Be Drivers.
Across the length of each gene (x axis), the number of missense mutations at each protein position is given (y axis). Vertical bars corresponding to mutations affecting binding sites are colored red. The band along the x axis depicts the likelihoods with which residues at each protein position are expected to interact with the specified ligand, with darker bars corresponding to higher (≥ 0.25) binding likelihoods. Domain locations and names are shown below.
(A) Putative cancer genes MGA and KLF5 are enriched for mutations in DNA base-binding positions.
(B) Putative cancer genes DIS3 and SF1 are enriched for mutations in RNA-binding positions.
(C) Putative cancer genes GSK3A and LGALS4 are enriched for mutations in small molecule- (ATP and β-galactoside sugar, respectively) binding positions.

